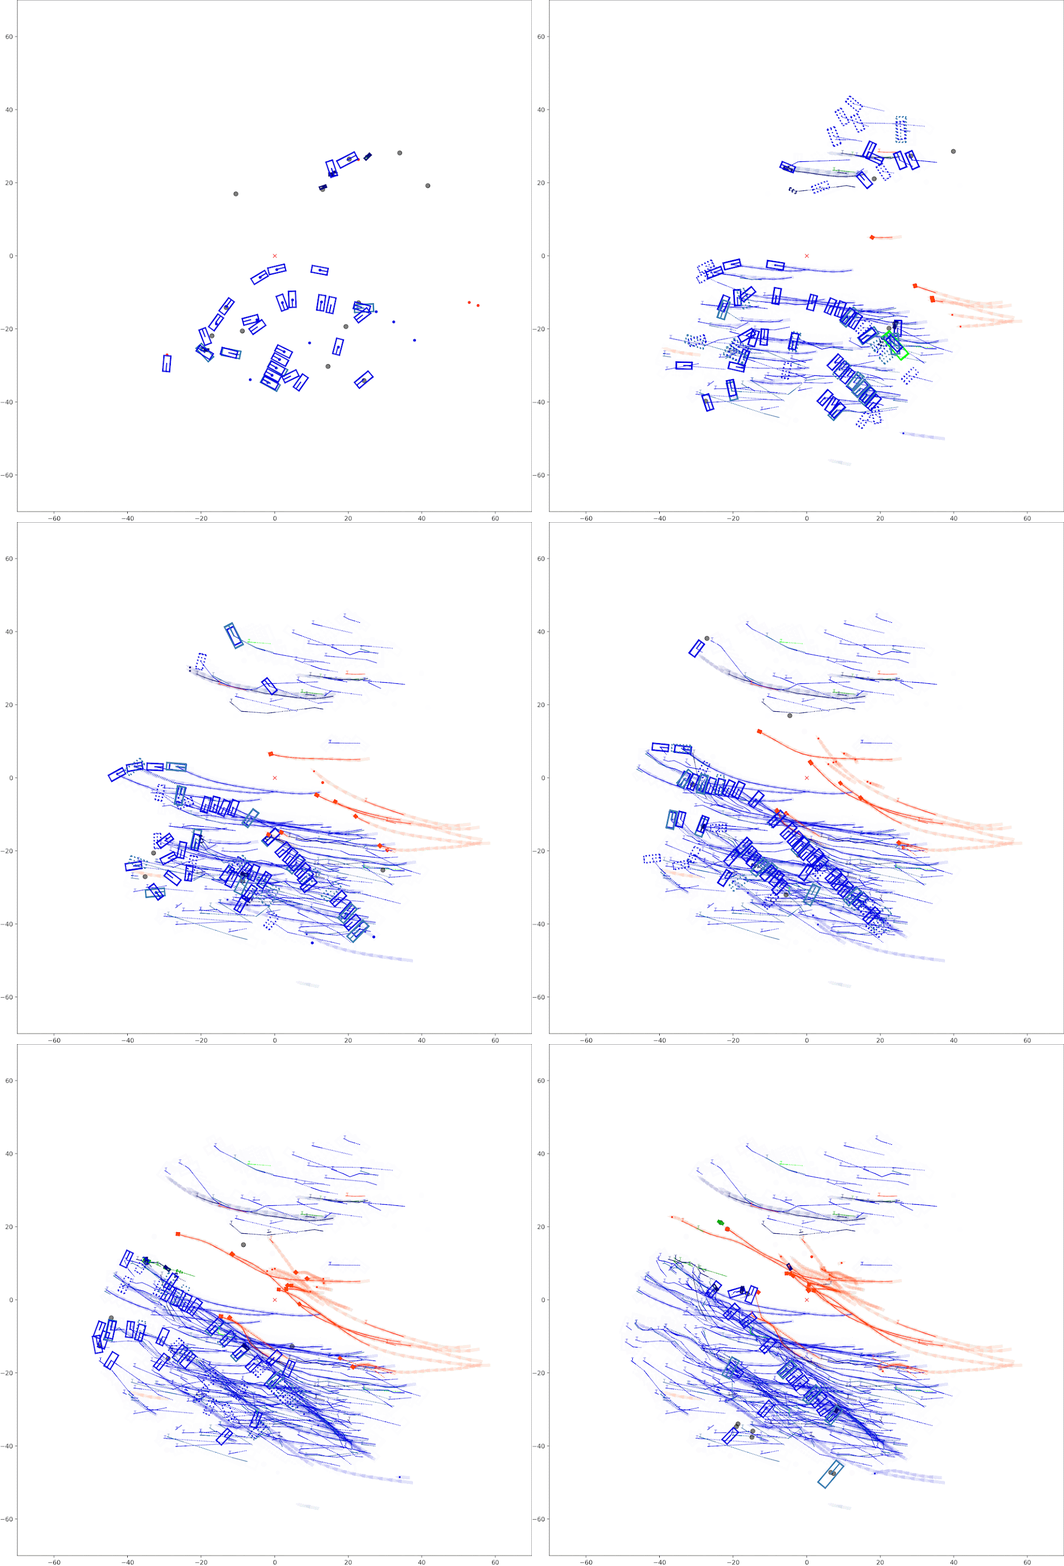
From probabilistic filters to real driving scenes: keeping object identities consistent through missed detections, crossings, and changing class labels.
Bai Liping · Random finite sets · Tracking by detection
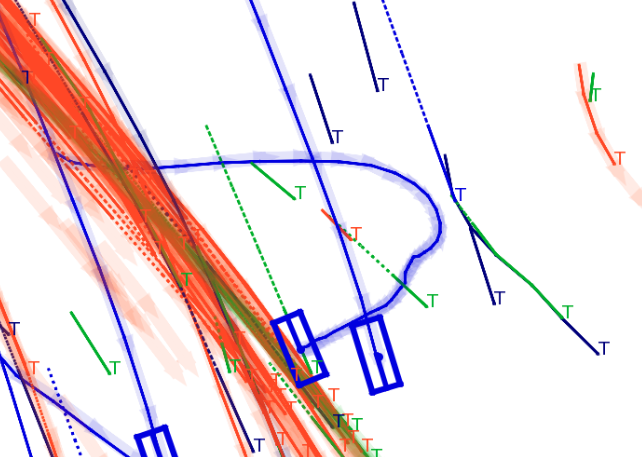
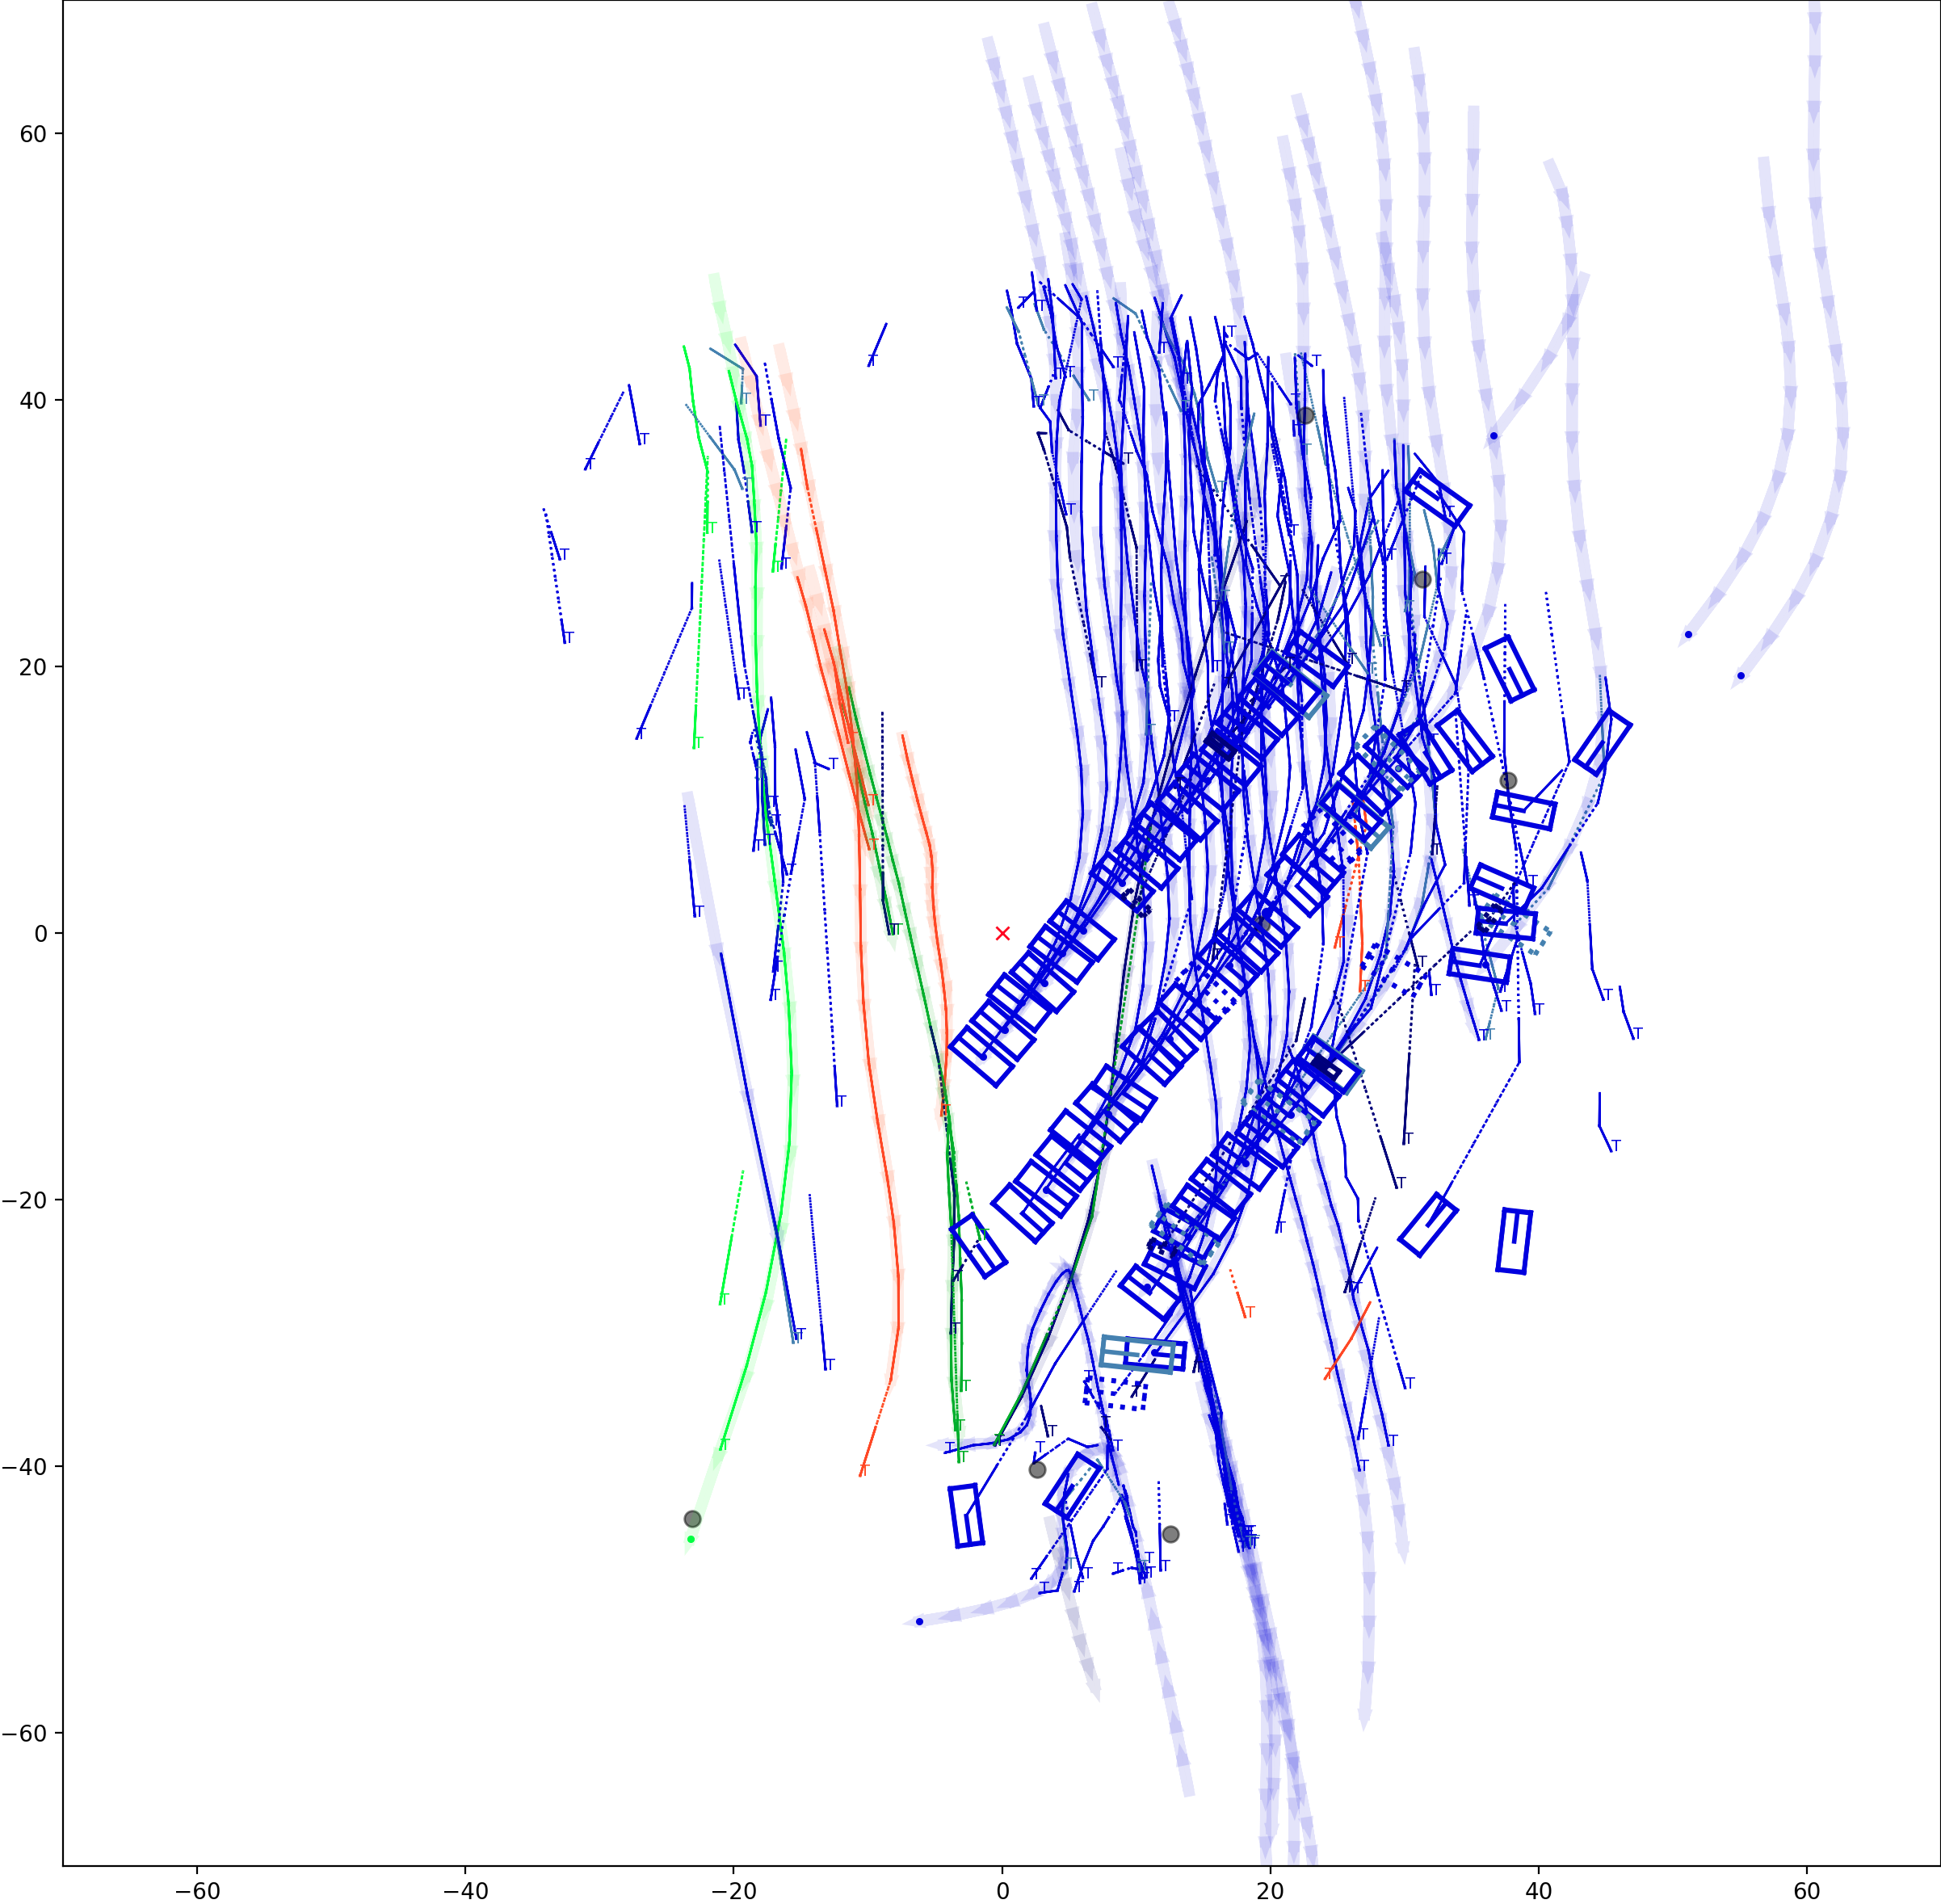
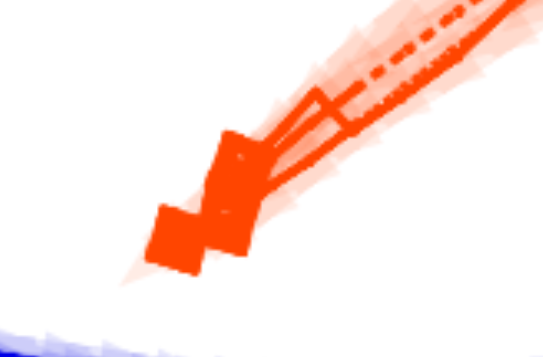
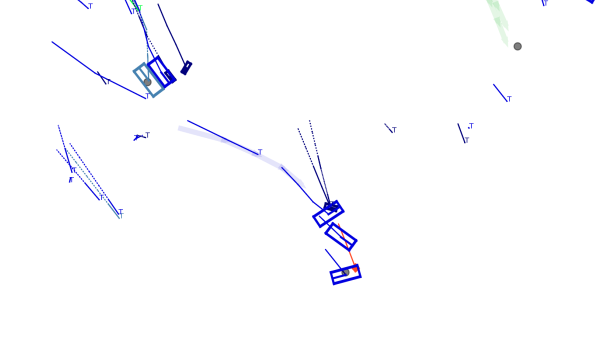
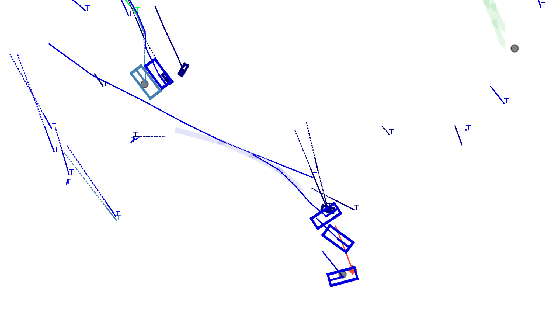
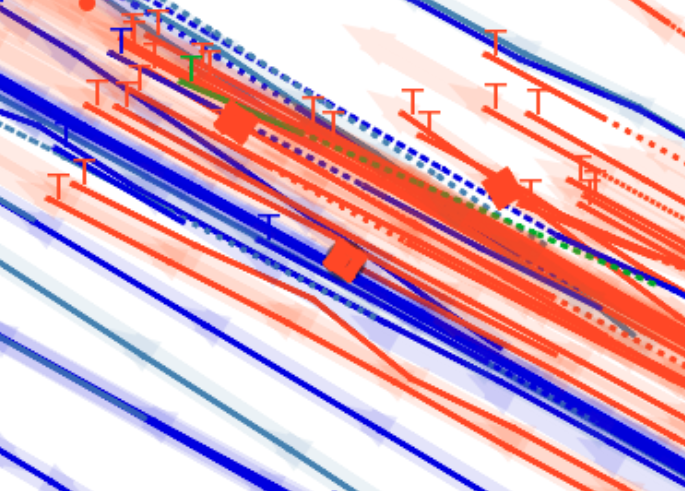
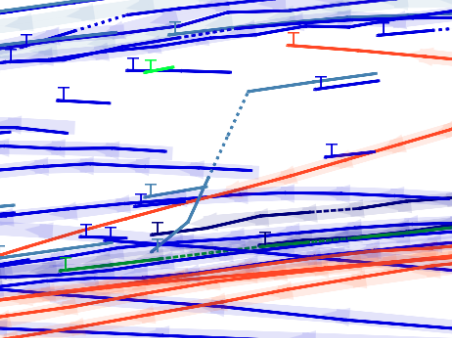
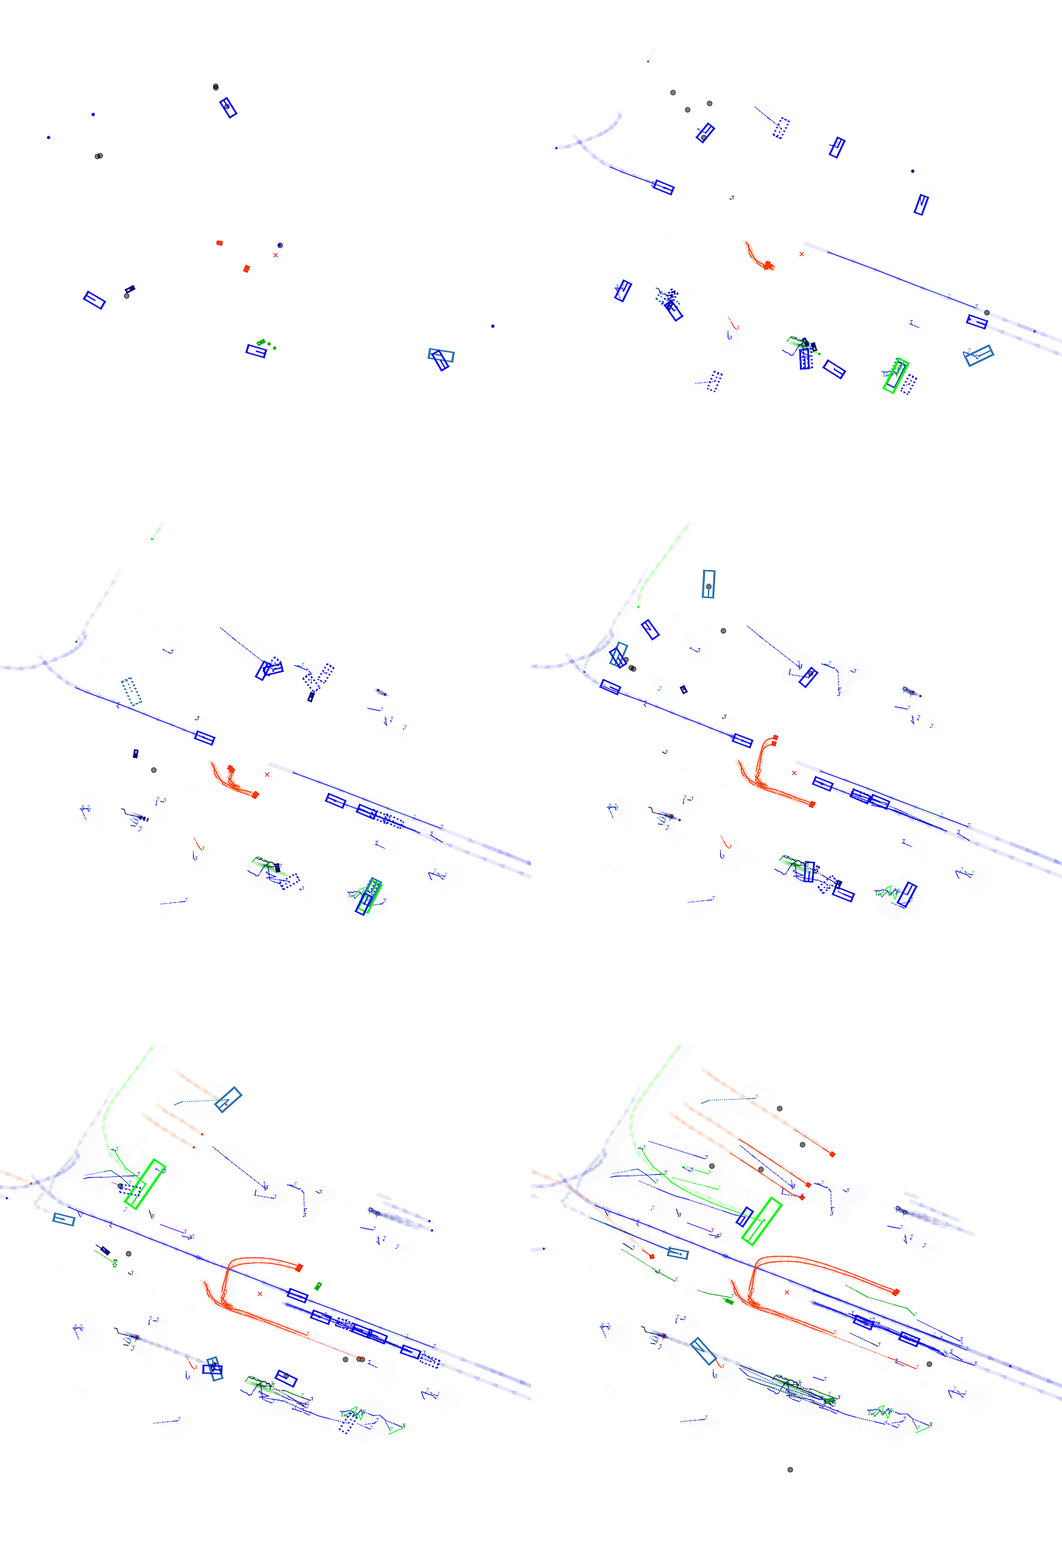
Original crossing sequence · 2× speed · continuous loop.
0.761AMOTAHigher is better
0.562 mAMOTPLower is better
6,019Validation samplesv1.0-trainval / val
7Tracking classesBicycle through truck
Recorded in the 0.761 evaluation log, October 12, 2022. These are archived validation results; the experiment has not been rerun for this page.
01 / The approach
Estimate the objects. Preserve their identities.
A detector produces boxes for each frame. A tracker must decide which boxes belong to existing objects, which indicate new arrivals, and which observations to reject. RFS models also represent uncertainty in how many objects exist.
UNDETECTED OBJECTS
The Poisson component
Represents objects that may exist but have not yet been detected. The birth model introduces the possibility of new objects.
DETECTED OBJECTS
Bernoulli tracks
Each candidate track carries a probability of existence and a distribution over its state. A missing detection reduces confidence without necessarily ending the track.
ASSOCIATION UNCERTAINTY
Competing explanations
A PMBM filter retains a mixture of association hypotheses. The repository’s PMBMGNN variant propagates the highest-weight global hypothesis to reduce that branching.
01Load detections
Boxes, class labels, scores, and velocity estimates in the nuScenes format.
02Predict tracks
Propagate position, velocity, survival, and possible object births.
03Associate & update
Gate candidate matches, update tracks, and manage alternative assignments.
04Evaluate & inspect
Export identities and boxes, calculate metrics, and examine scene-level errors.
What this work covers. The repository collects classical and RFS tracking implementations, simulation experiments, and a nuScenes application. The main contribution presented here is the experimental workflow and visual diagnosis. The filter families and their underlying theory have established prior implementations.
02 / Recorded results
One run, with its context.
The attached log explicitly identifies the validation split and 6,019 samples. It does not establish the exact detector checkpoint or tracker configuration, so this result is presented as an archived run rather than a controlled comparison.
Per-class results · saved 0.761 run
Class
AMOTA ↑
AMOTP ↓ (m)
ID switches
Bicycle
0.674
0.663
2
Bus
0.873
0.523
9
Car
0.861
0.339
420
Motorcycle
0.823
0.532
10
Pedestrian
0.831
0.414
131
Trailer
0.529
0.936
2
Truck
0.739
0.528
28
Read accuracy and identity together.
The log reports 602 identity switches and 286 track fragmentations. Those counts motivate a closer look at individual trajectories even when the average accuracy is strong.
Class differences matter. Bus AMOTA is 0.873, while trailer AMOTA is 0.529. The aggregate score hides substantial variation across object classes.
AMOTA averages recall-normalized tracking accuracy over recall thresholds. AMOTP summarizes position error over recall thresholds. Consult the nuScenes metric definitions for the exact evaluation protocol.
The log’s ID-switch and fragmentation counts are the evaluator’s reported operating-point statistics; they are not averaged in the same way as AMOTA.
The observations are organized below by failure mechanism. Each example distinguishes the recorded observation from the interpretation or improvement it suggests.
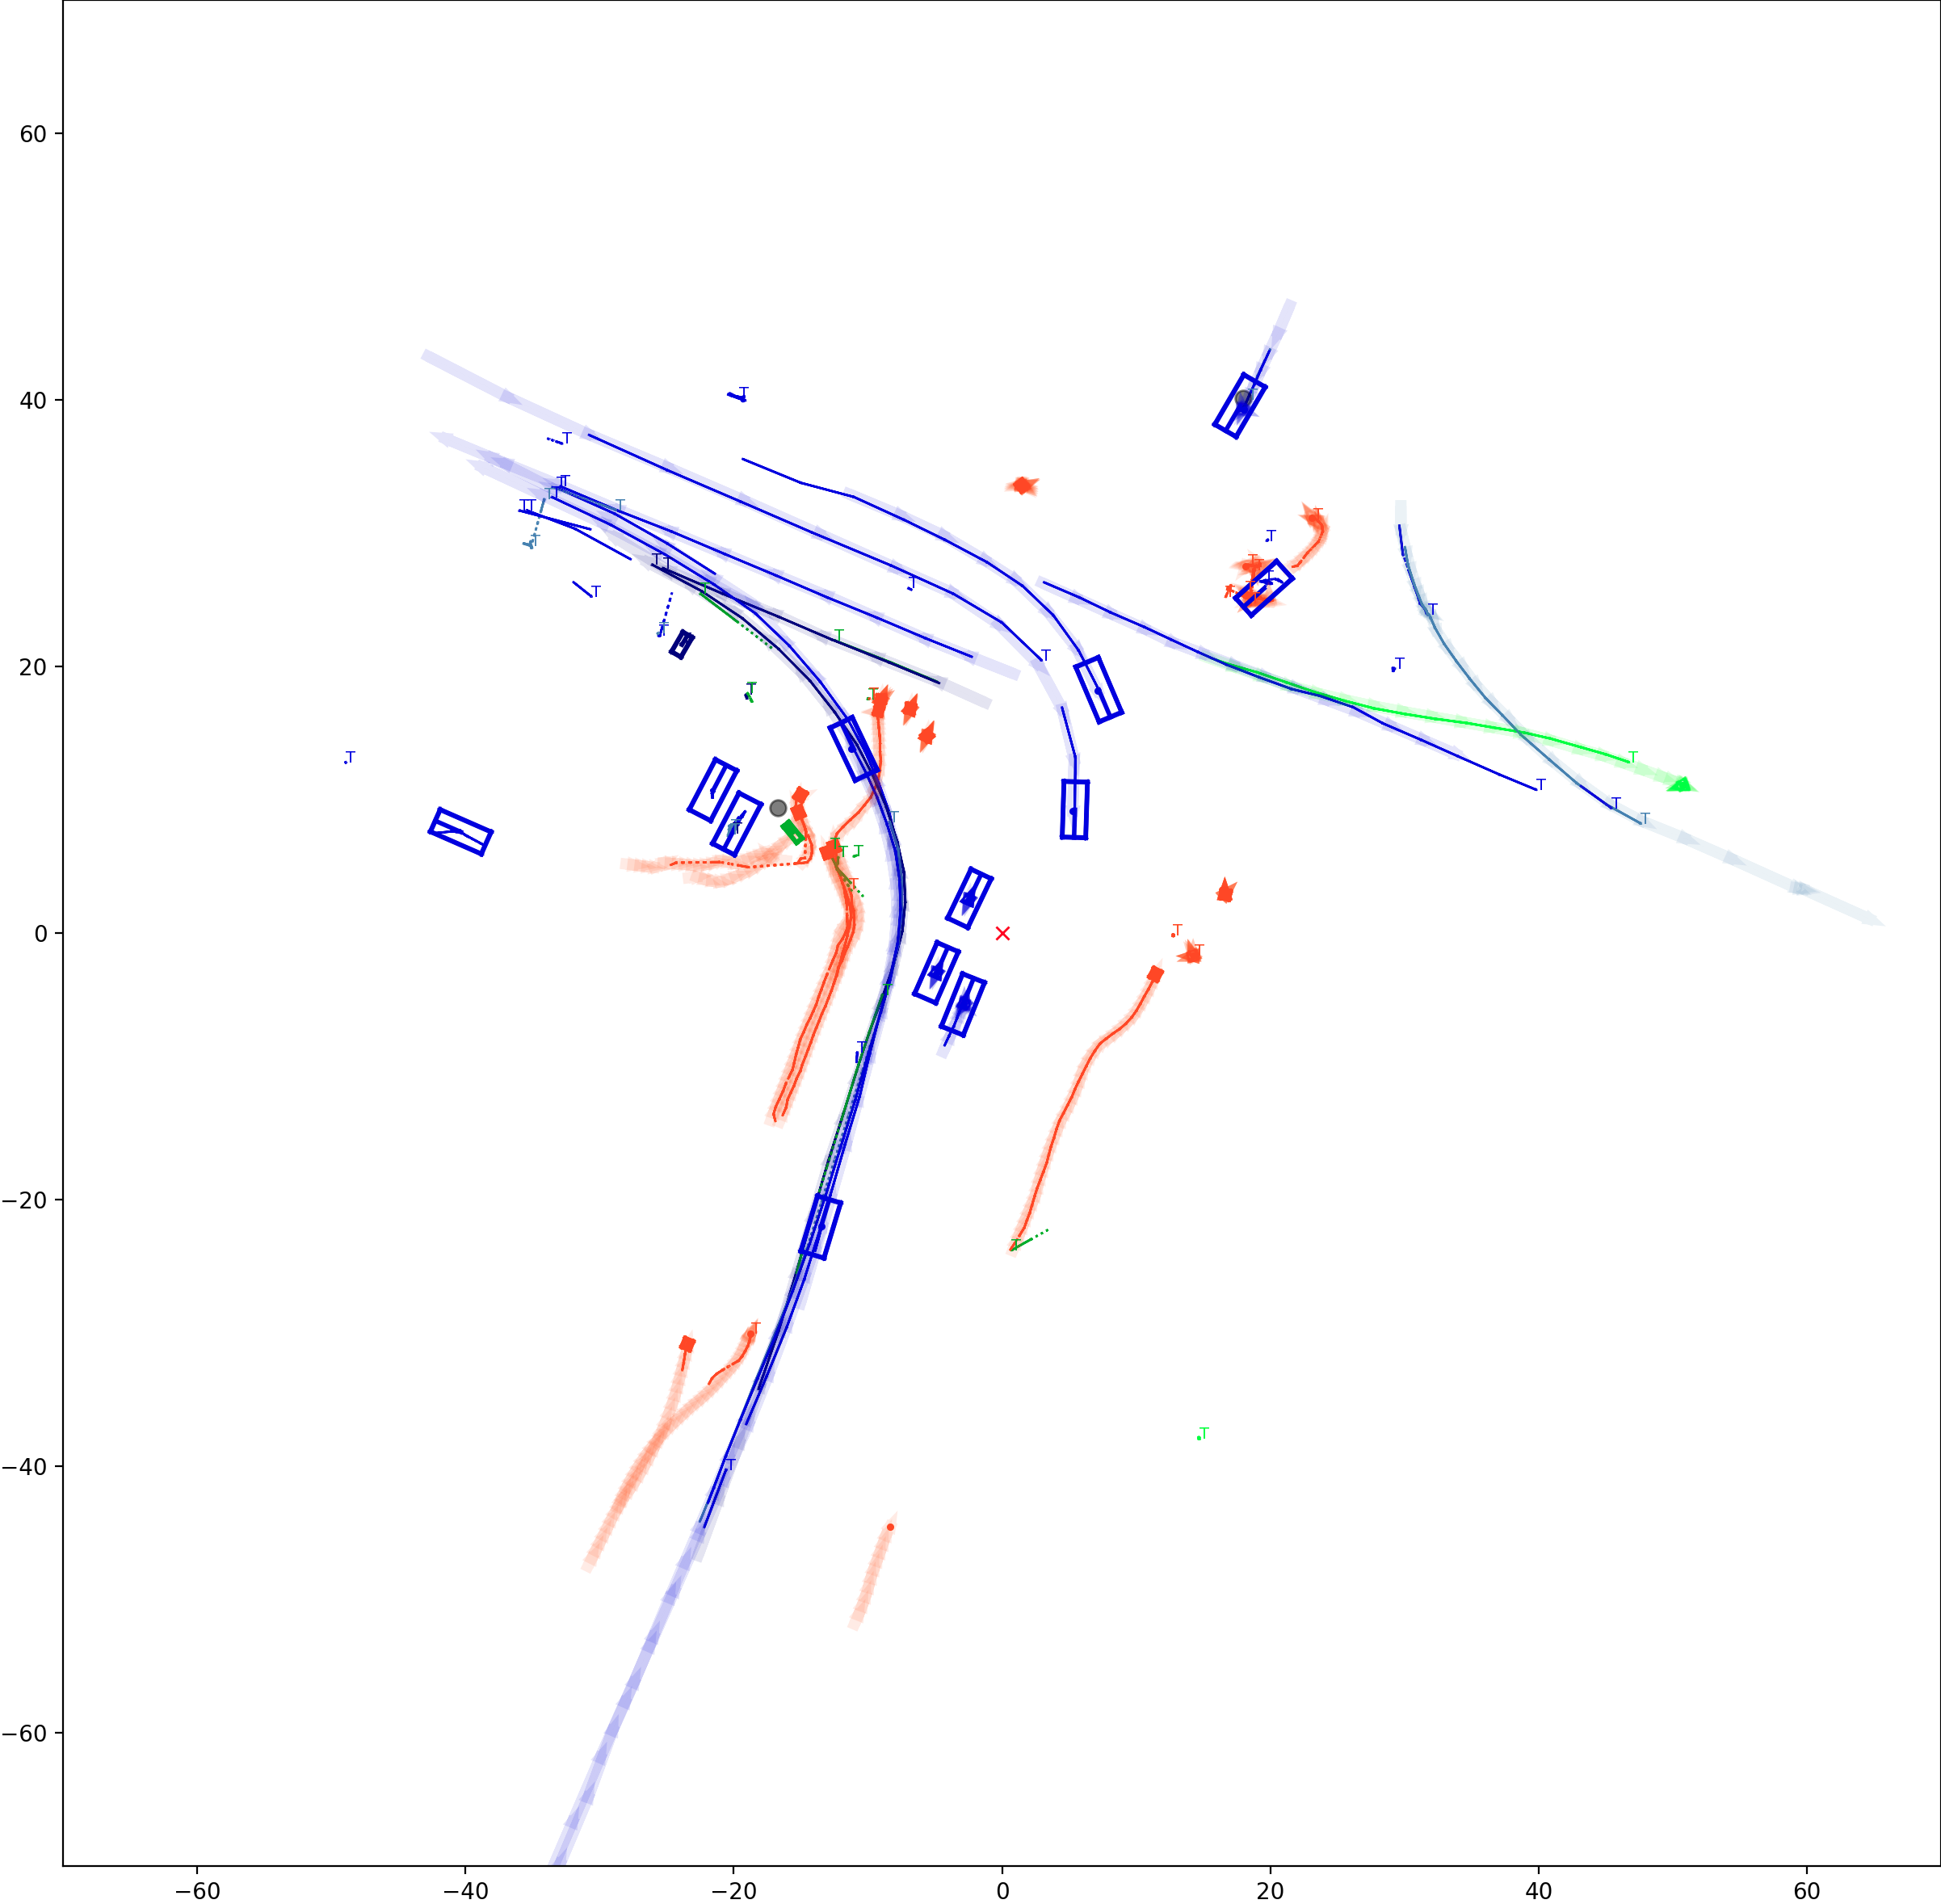
01 · Missed detection
Occlusion creates a gap in the evidence.
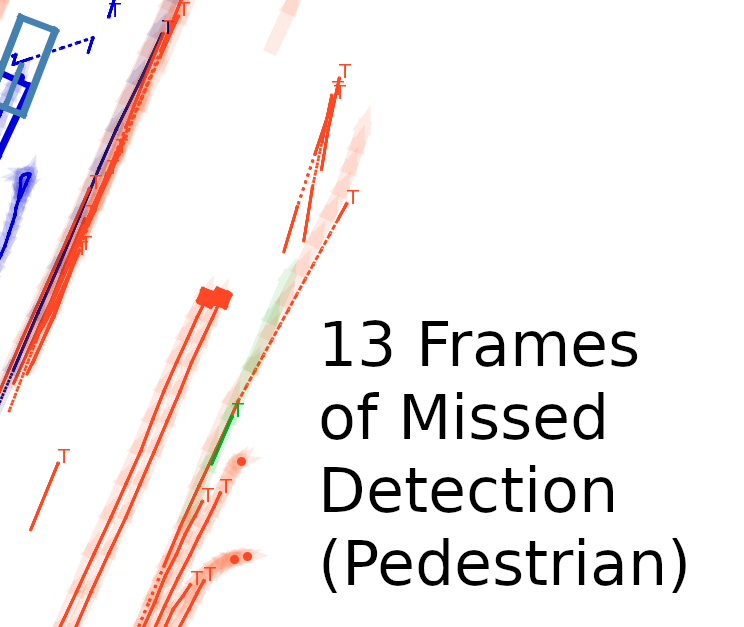
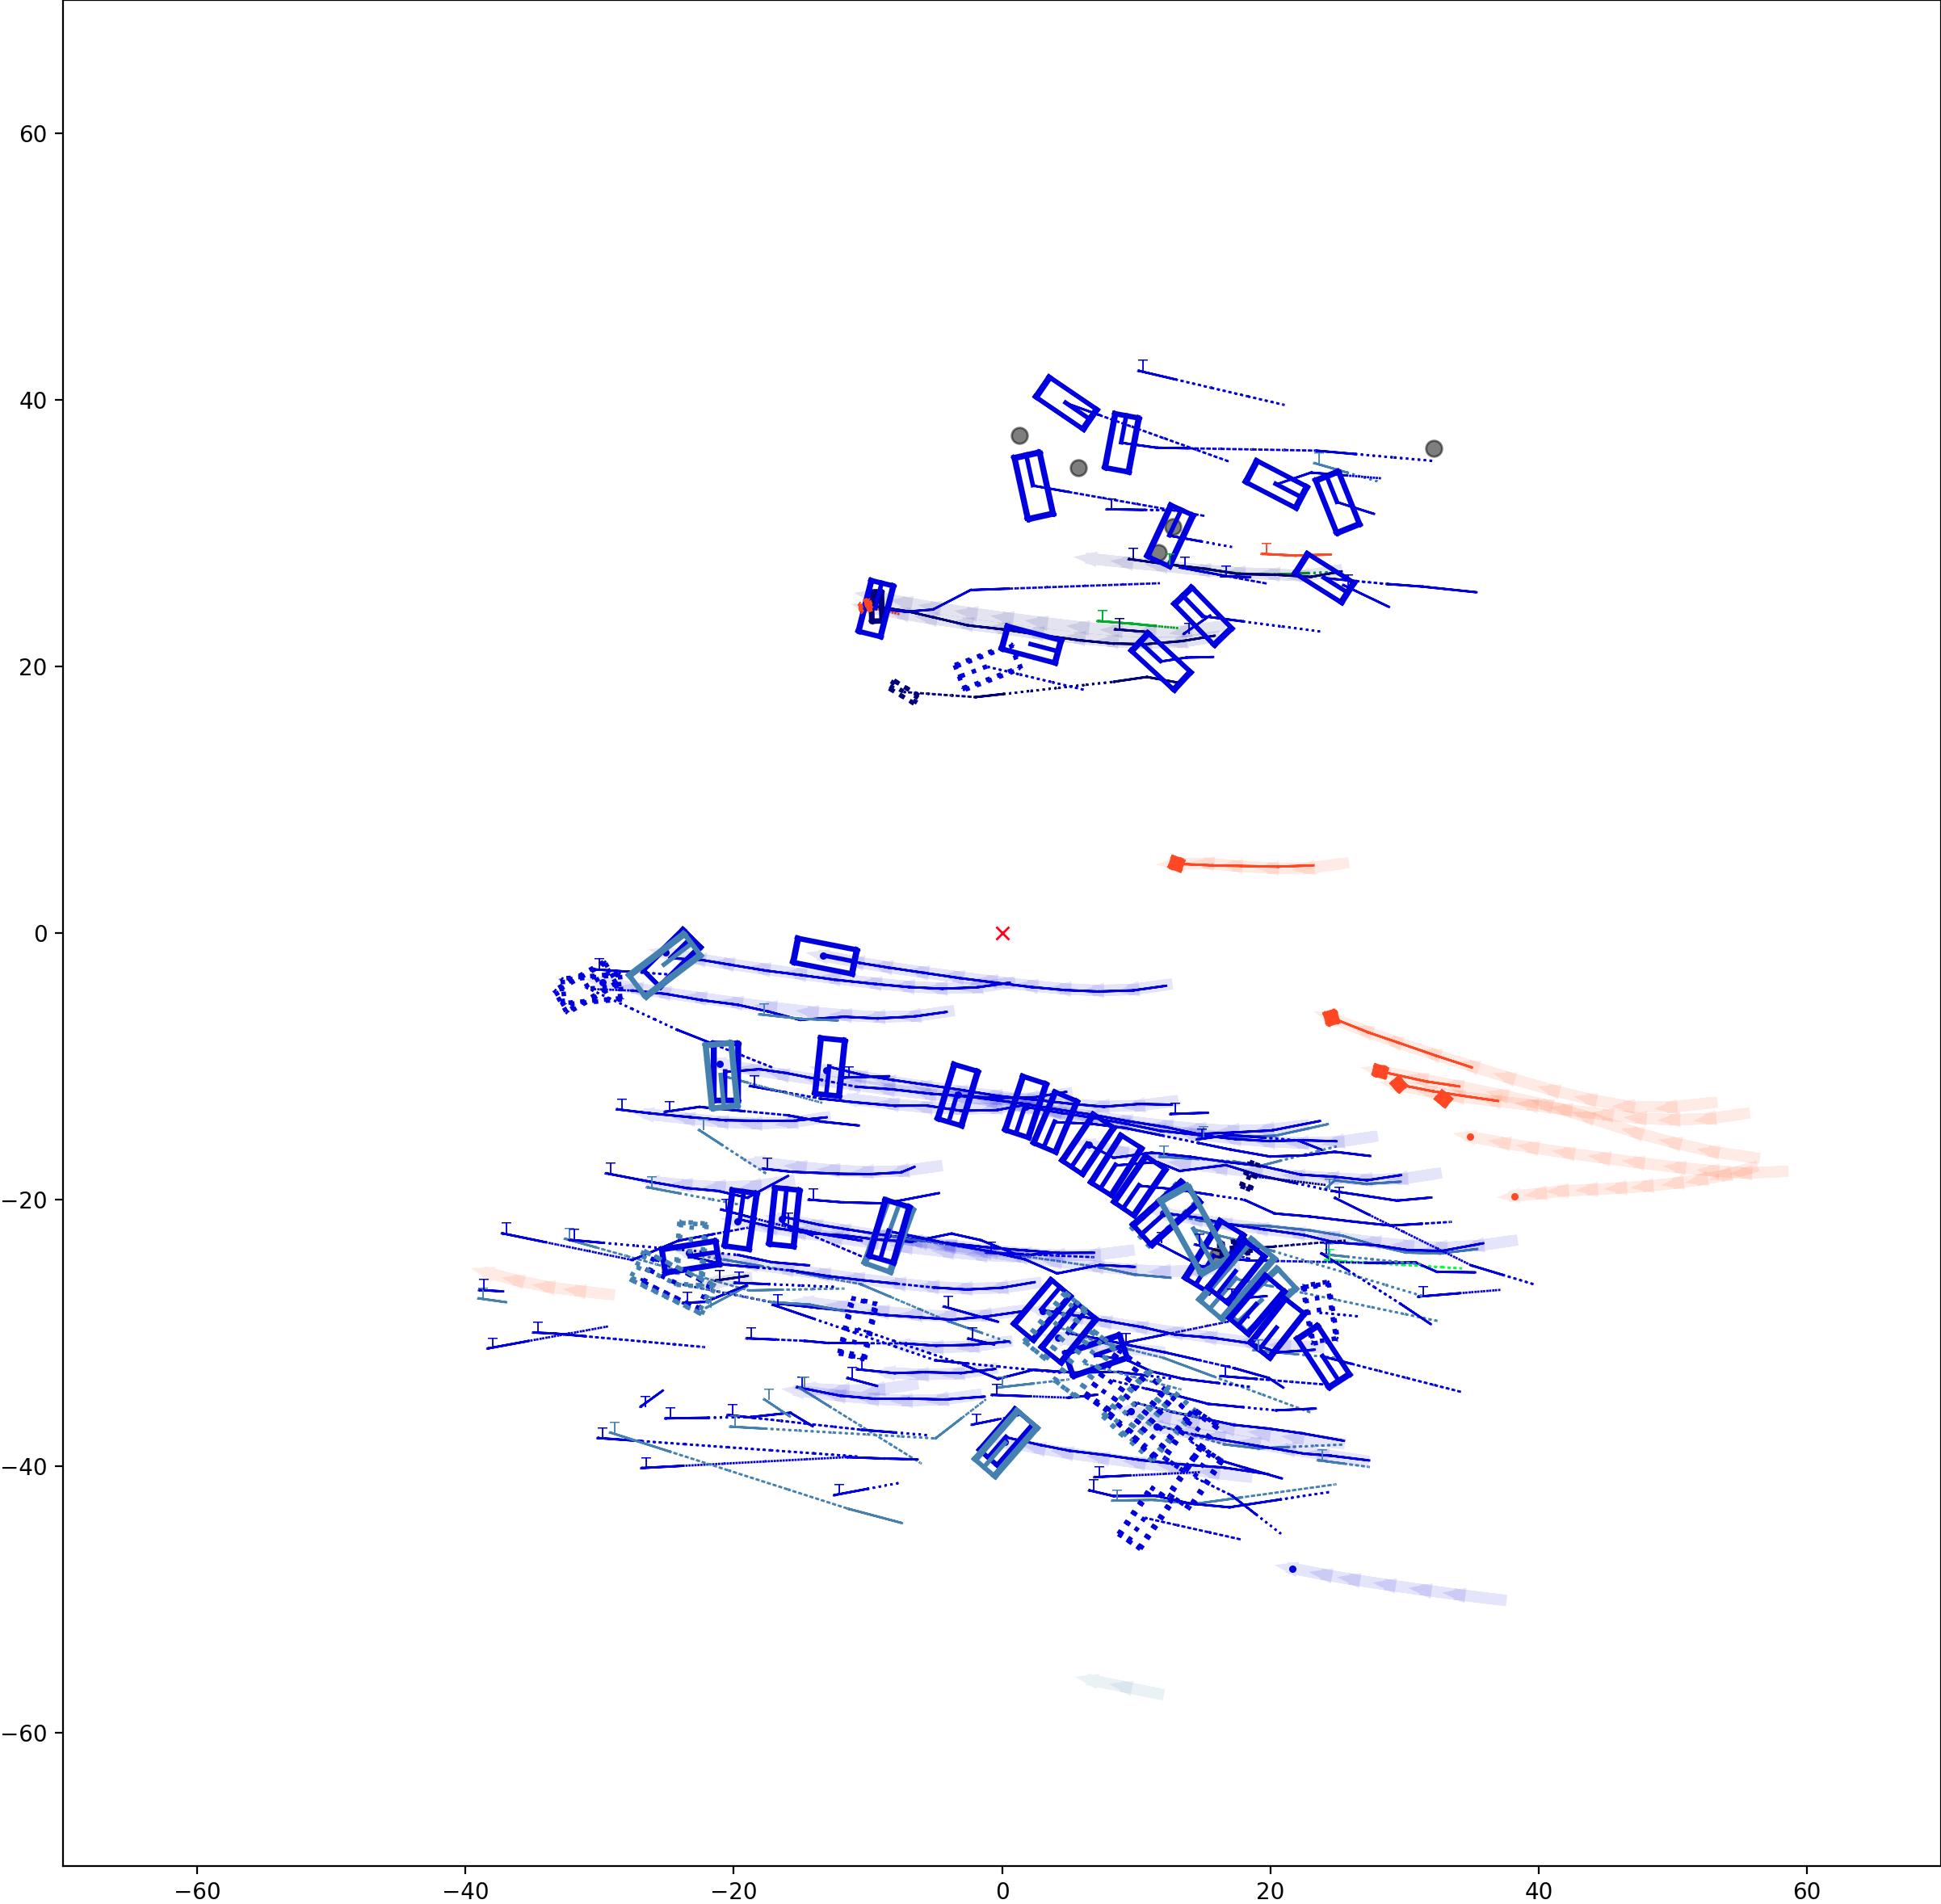
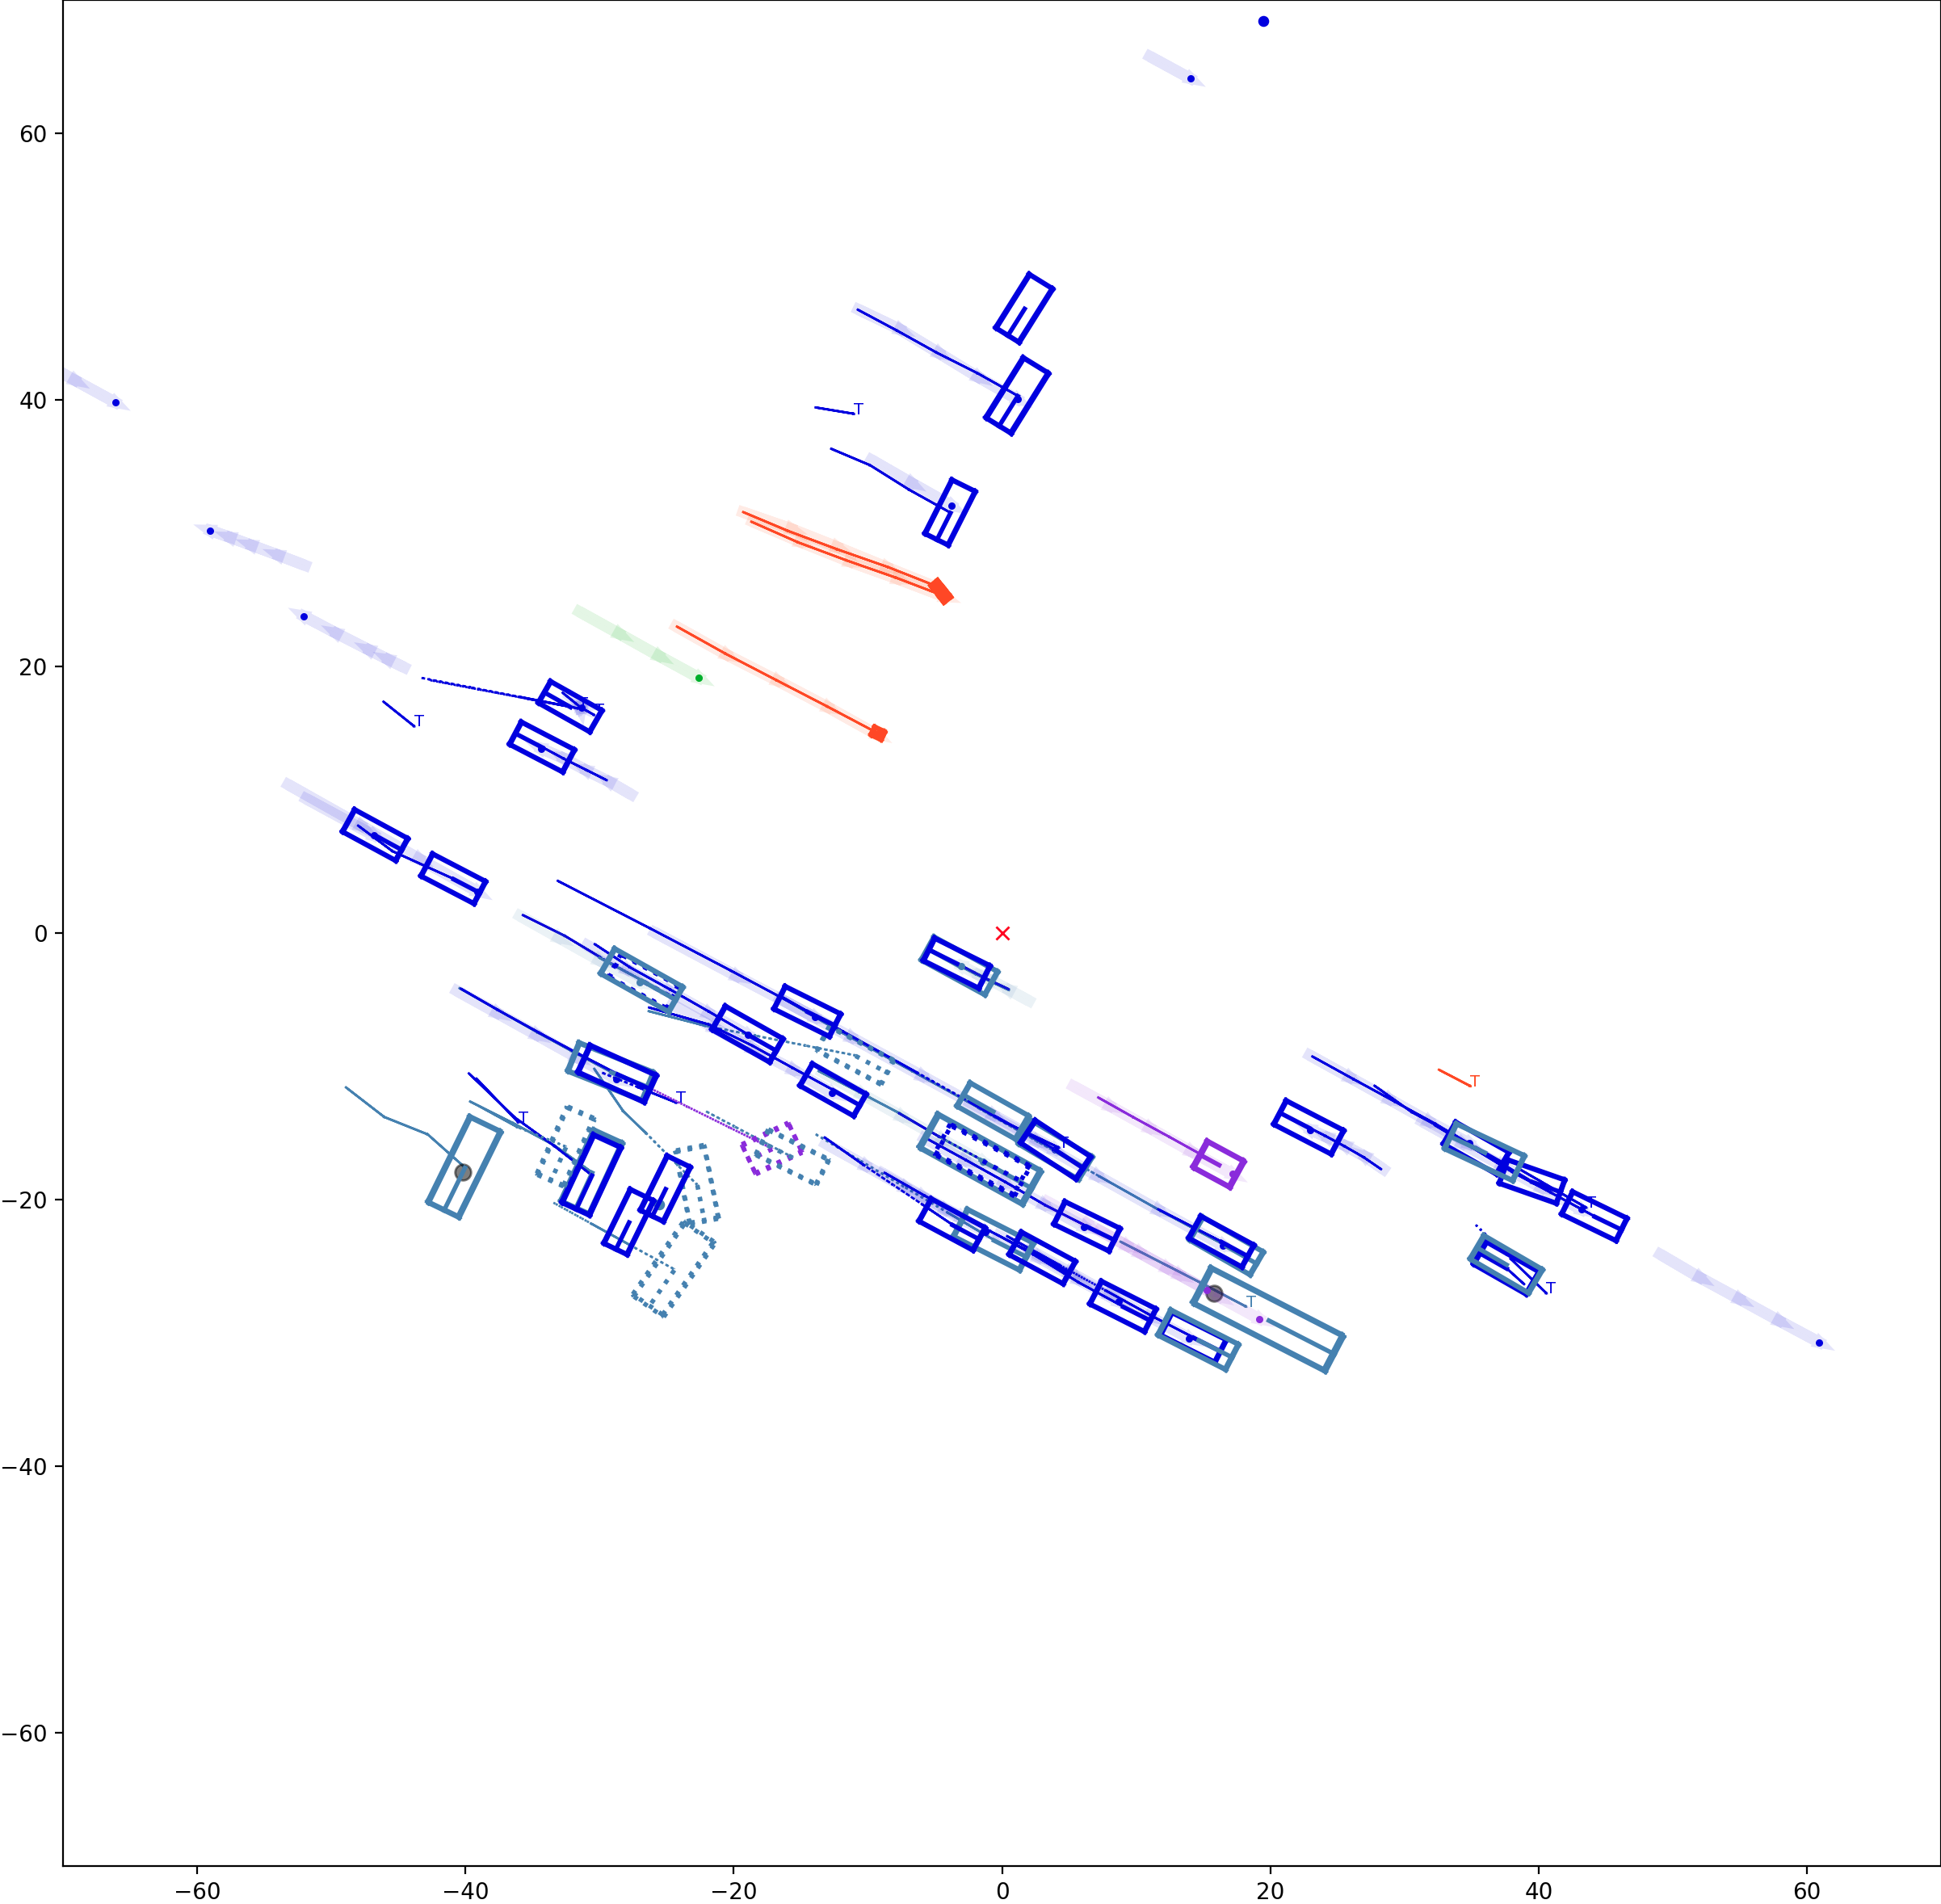
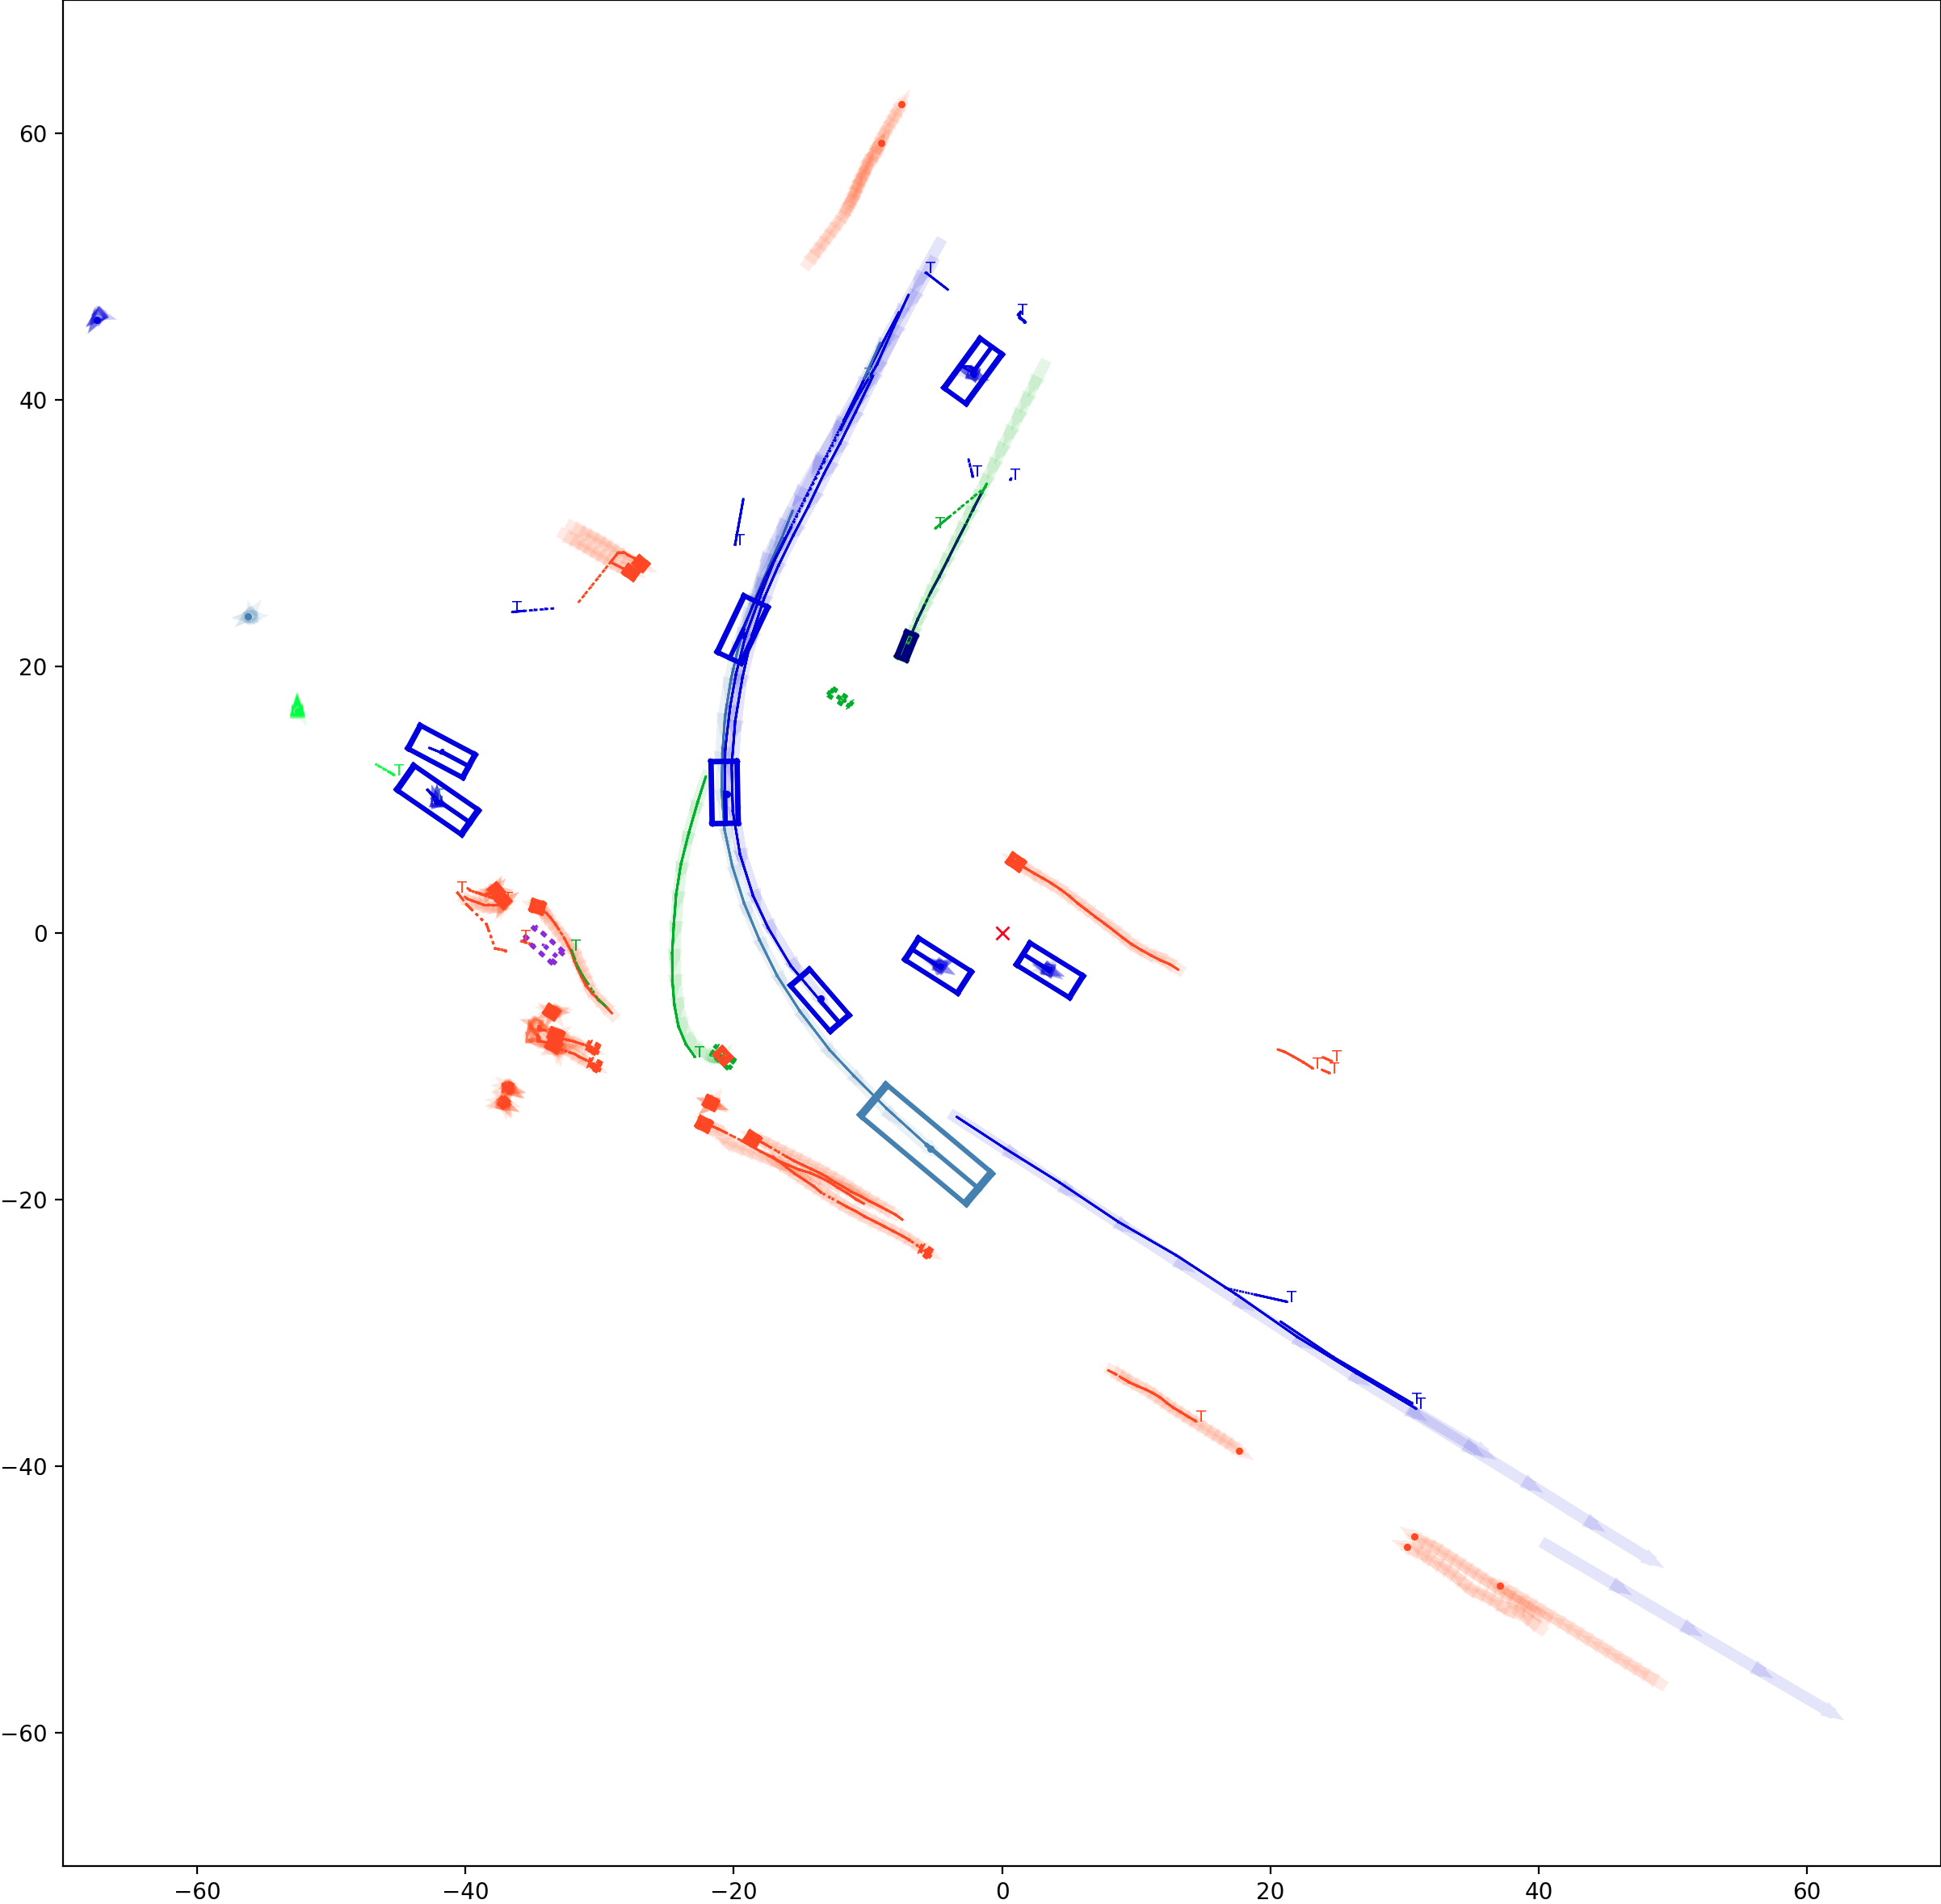
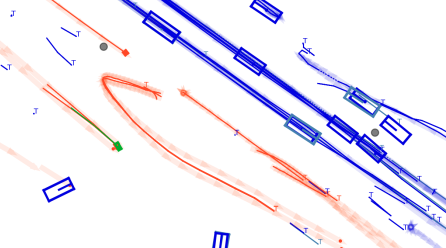
The example marks 13 frames of missed pedestrian detection. With no matching measurement, the tracker must balance survival against the chance that the object has left.
Implication: examine existence decay and track management across the gap, as well as the quality of the detections.
The source annotates 13 frames of missed detection for a pedestrian.
02 · Birth versus continuation
A new identity can win over an existing track.
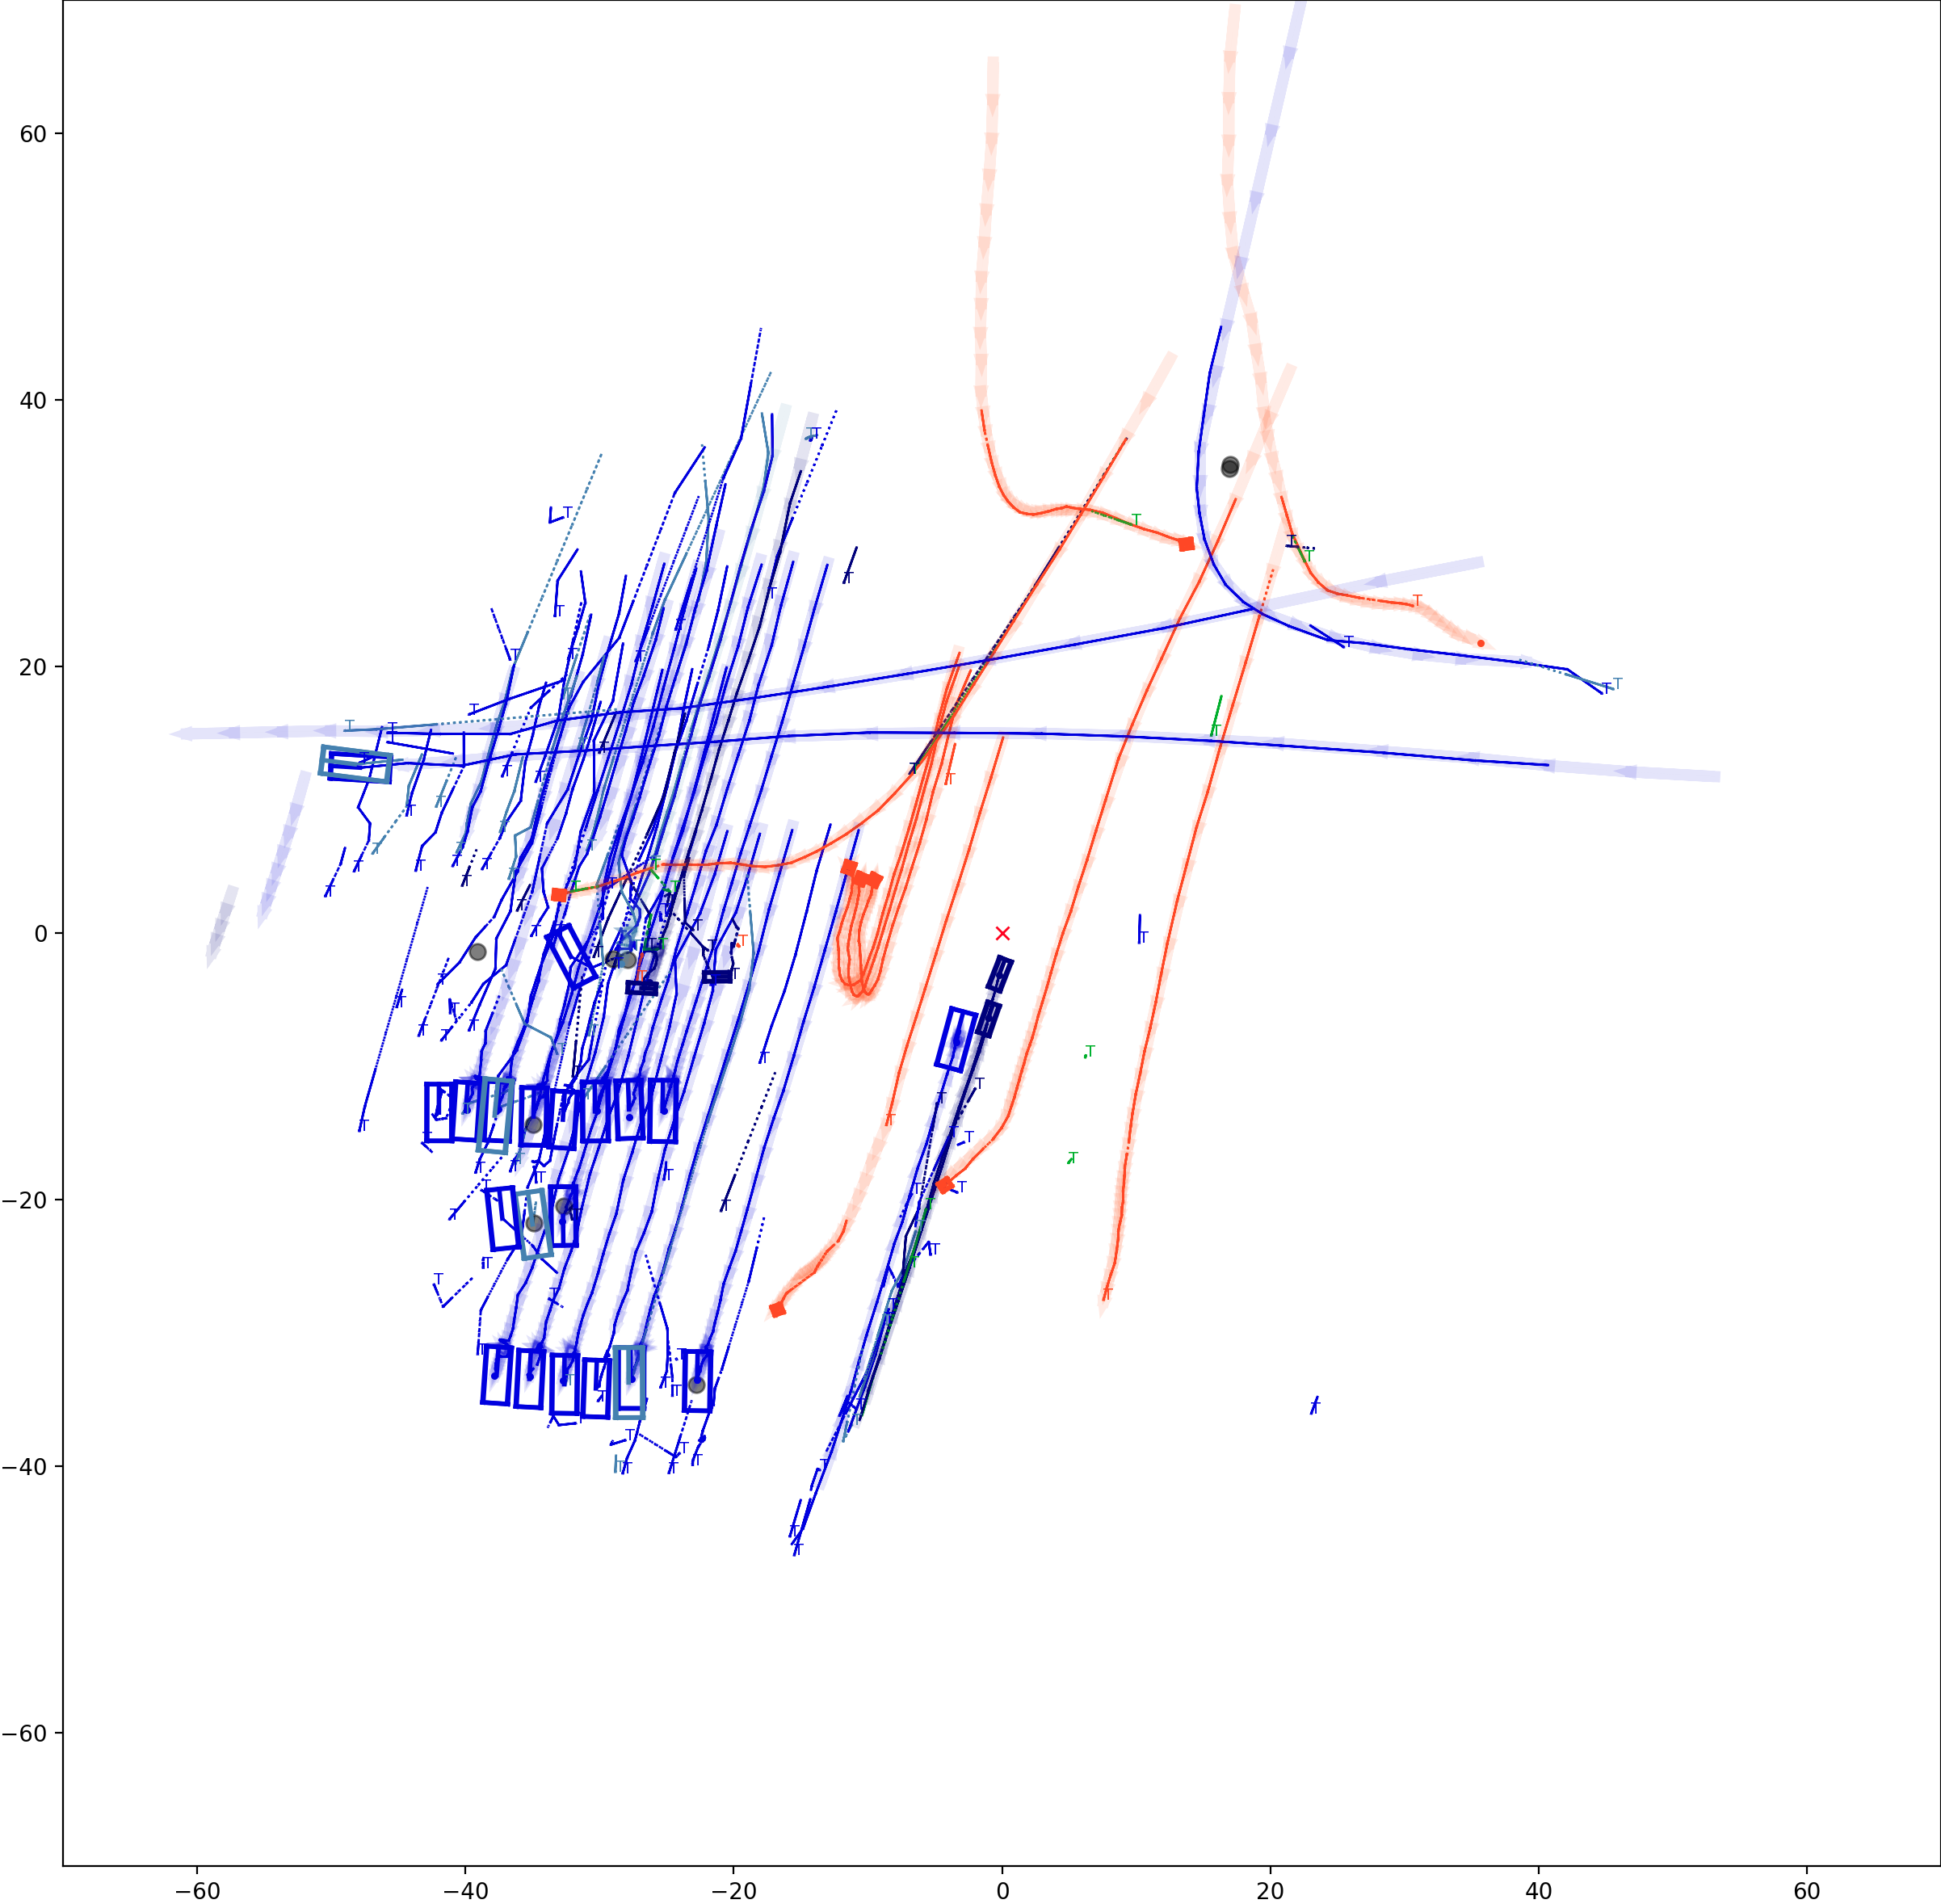
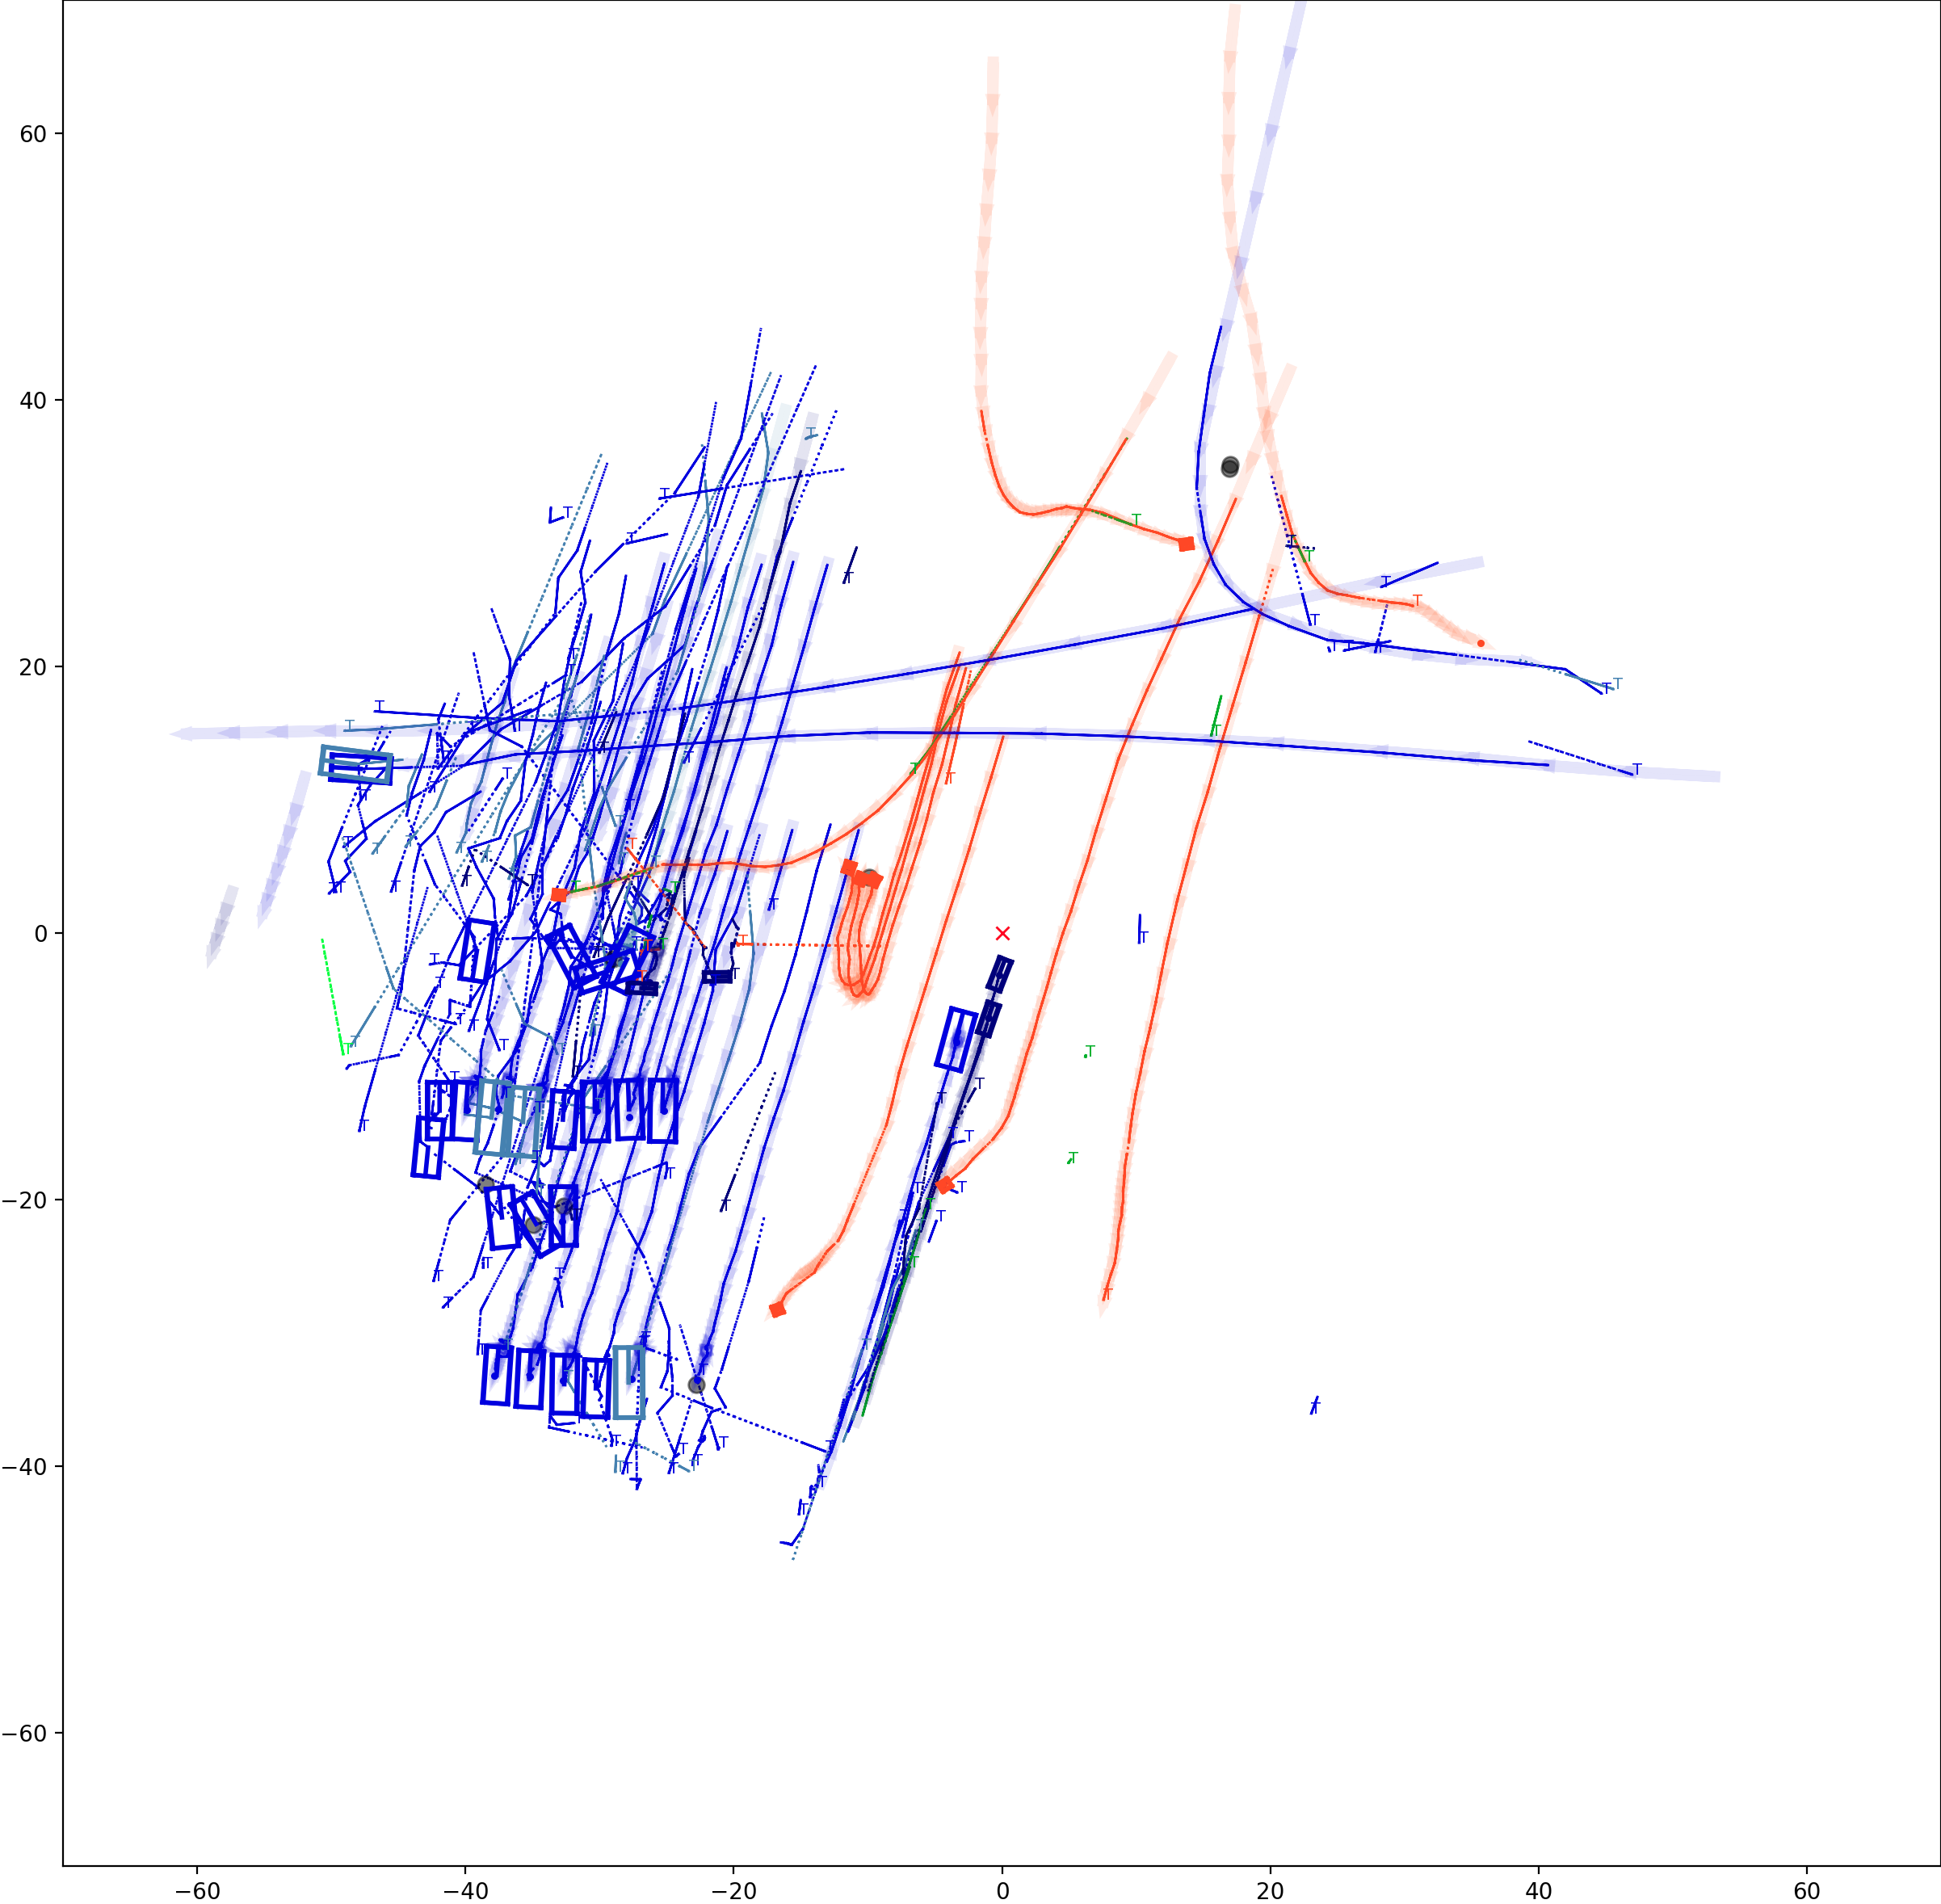
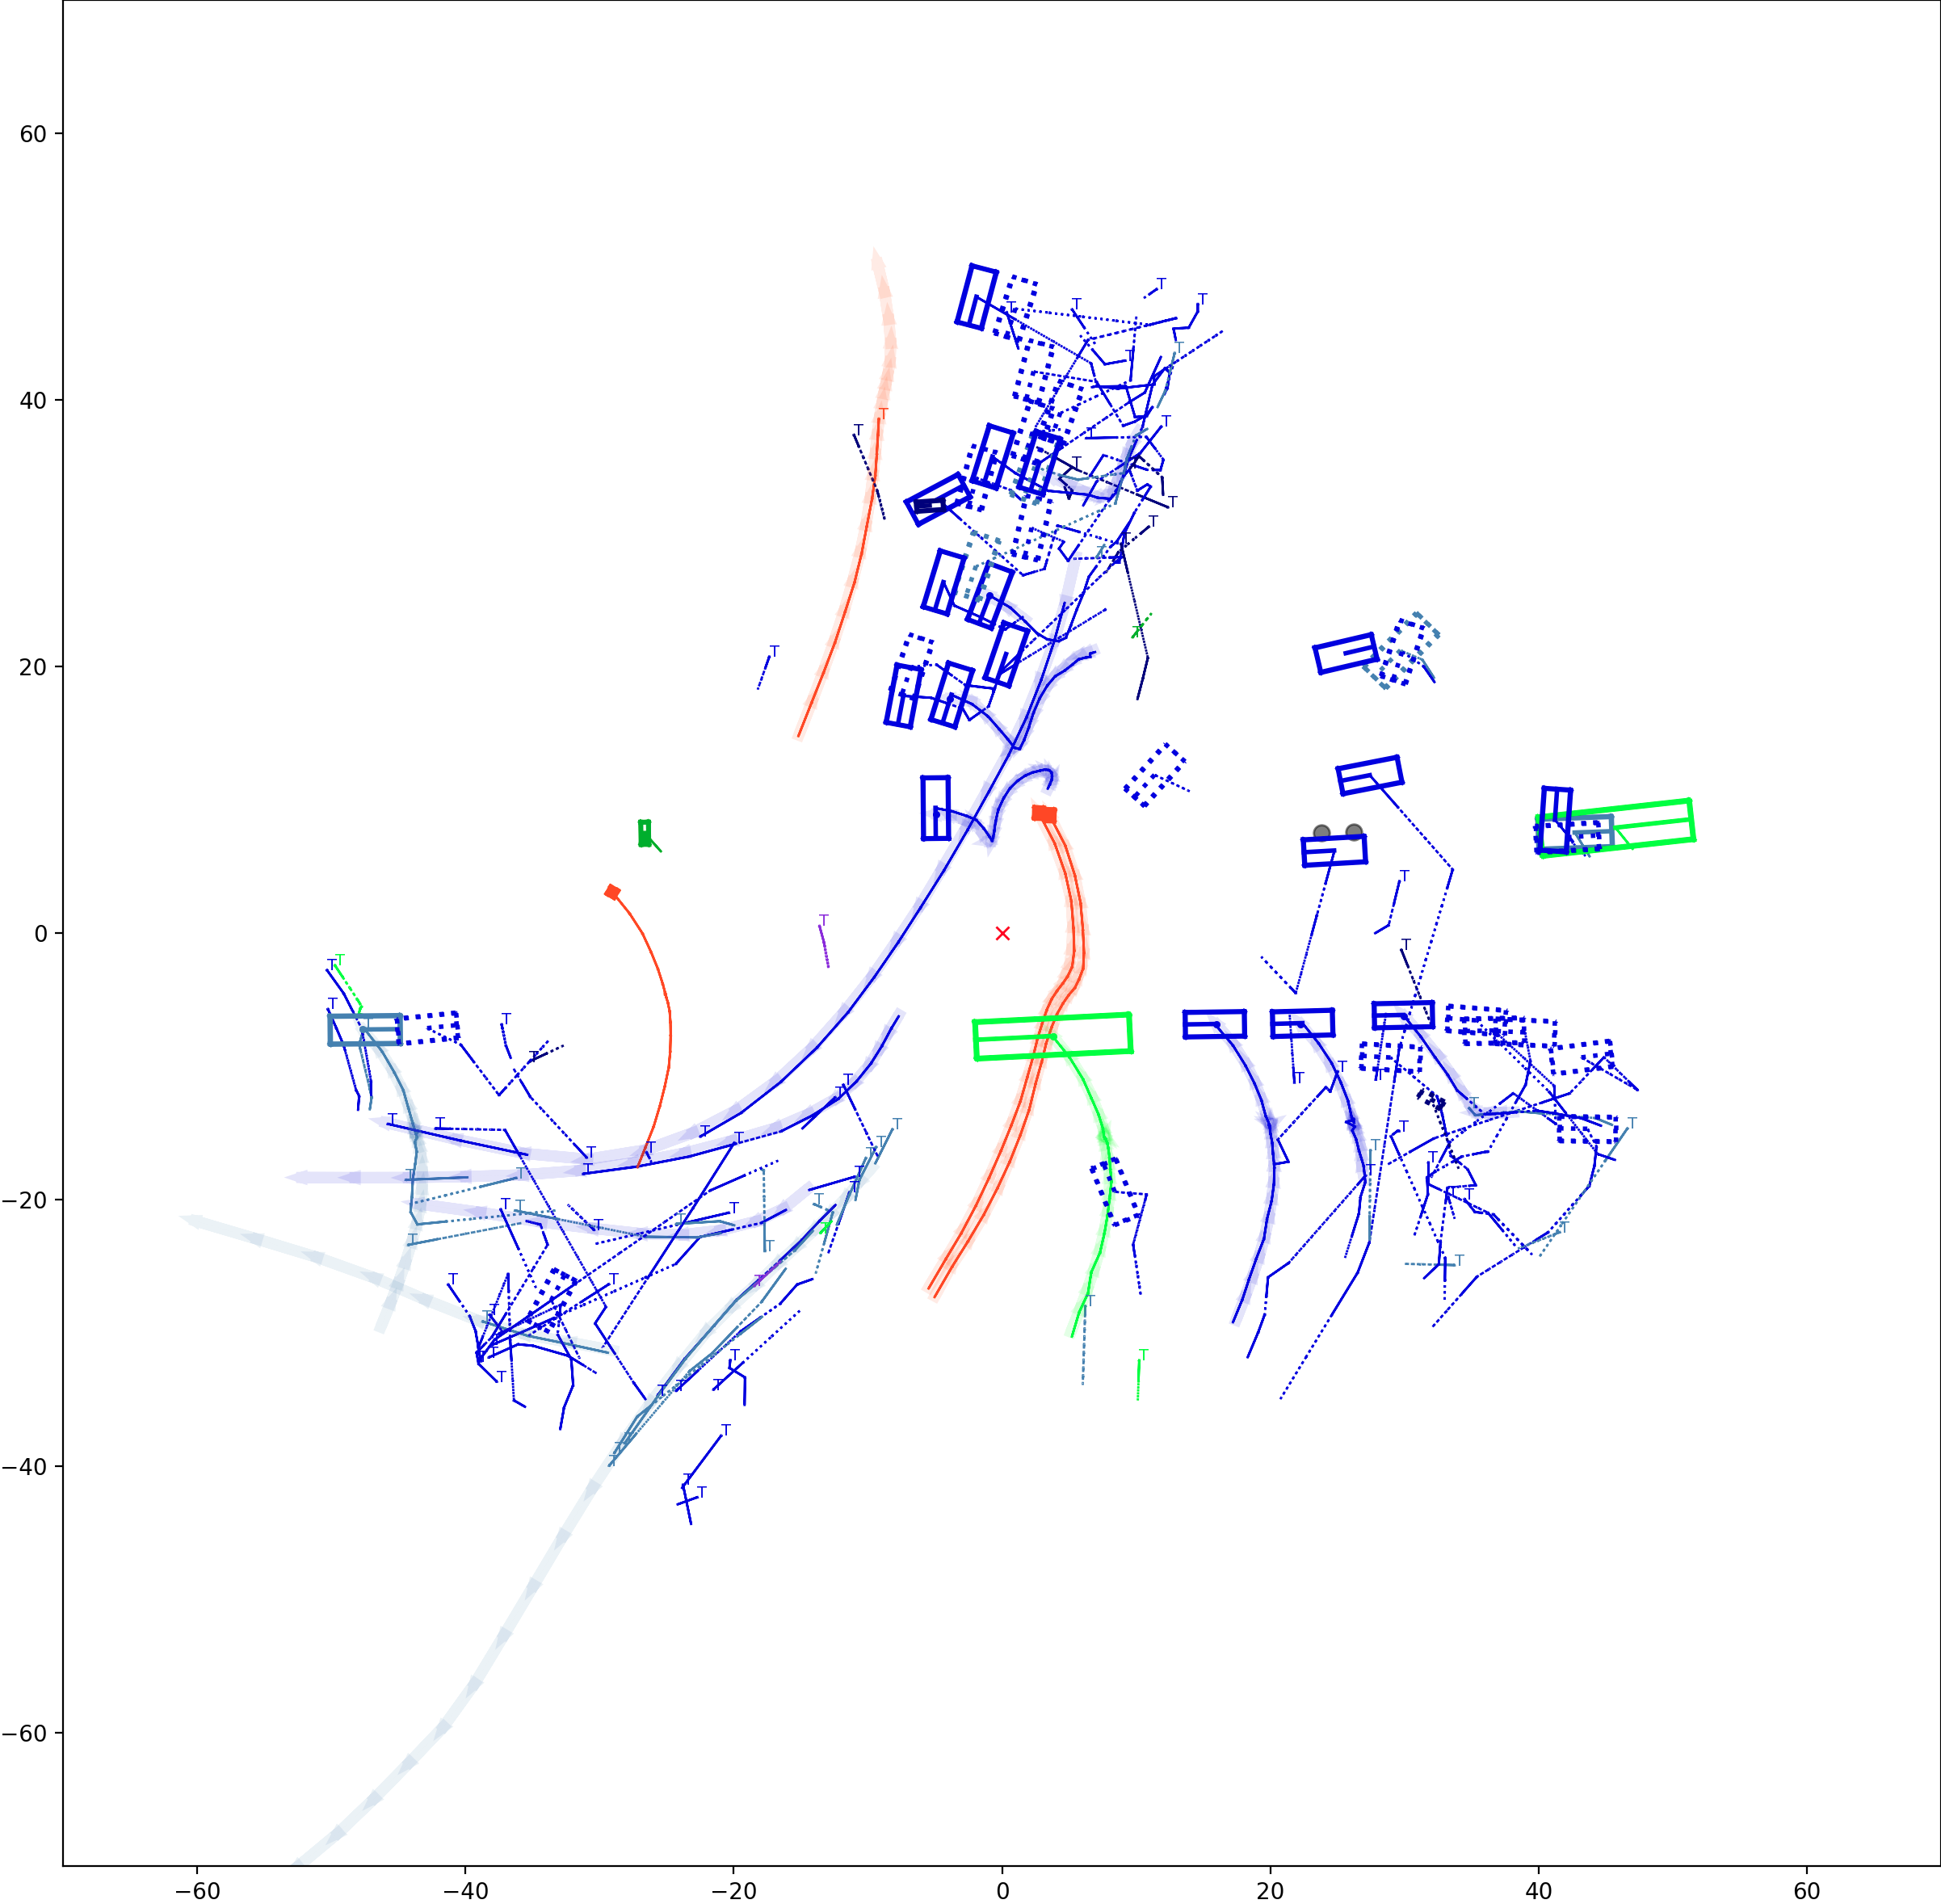
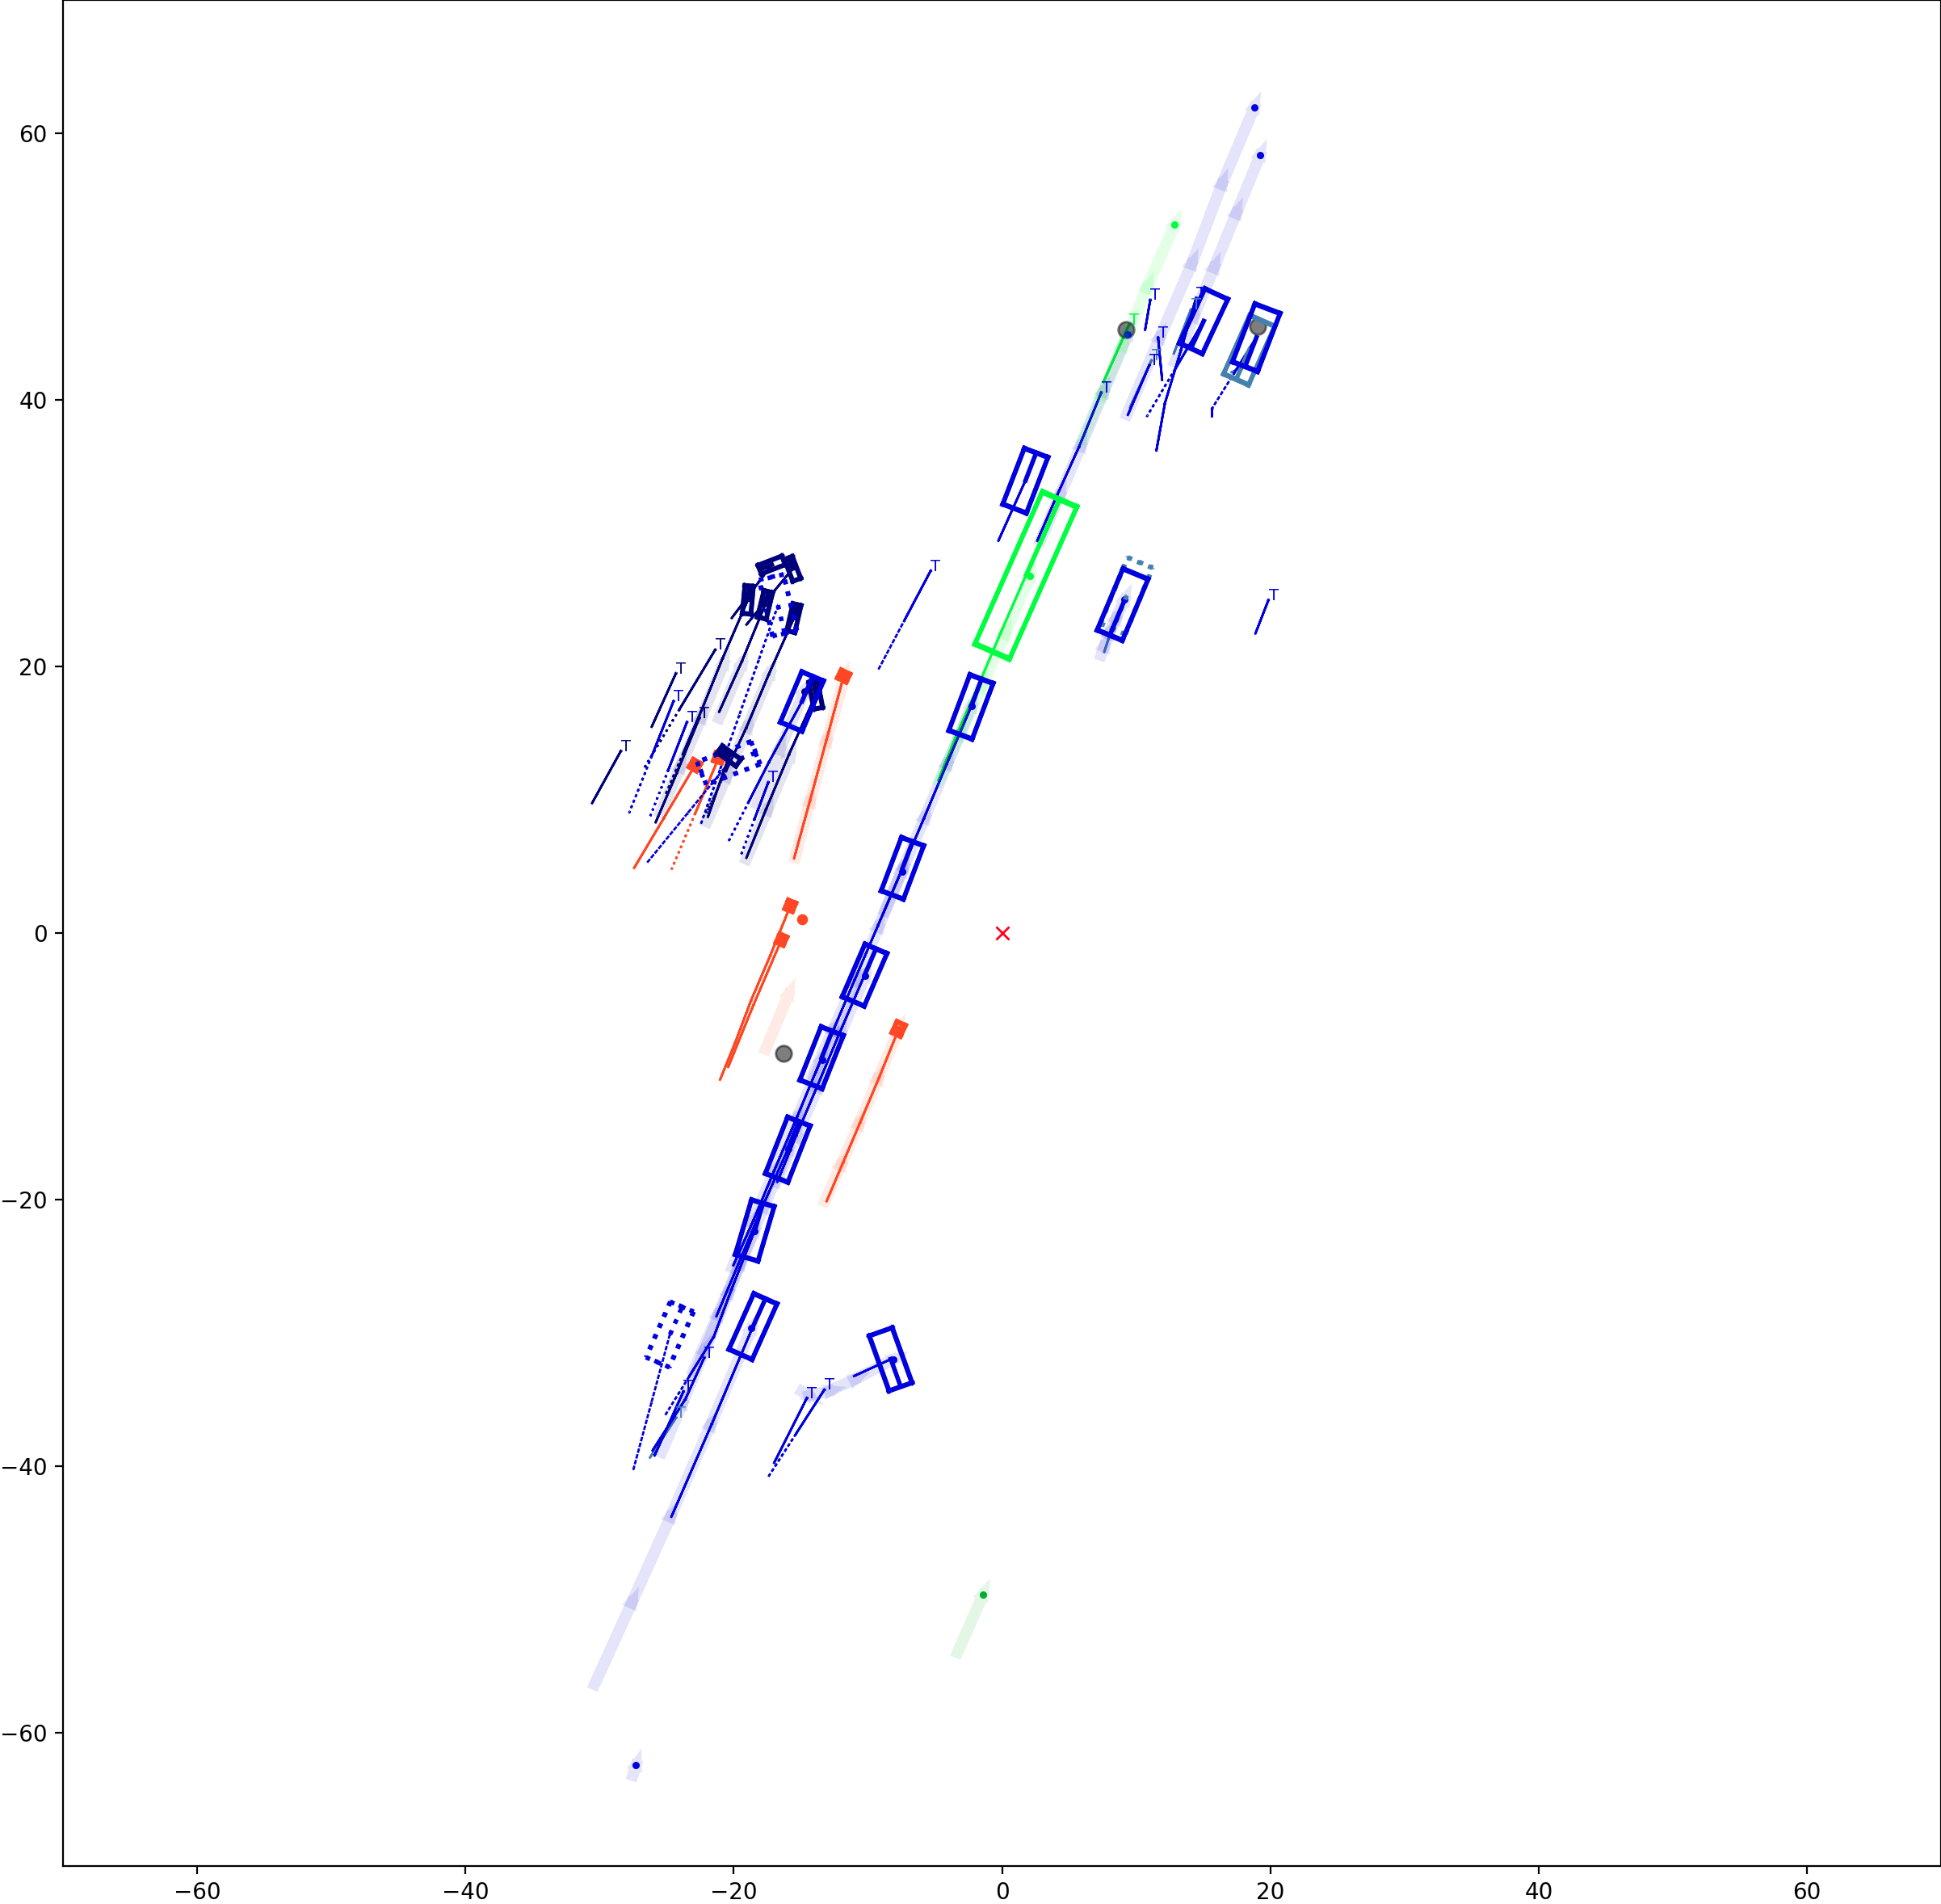
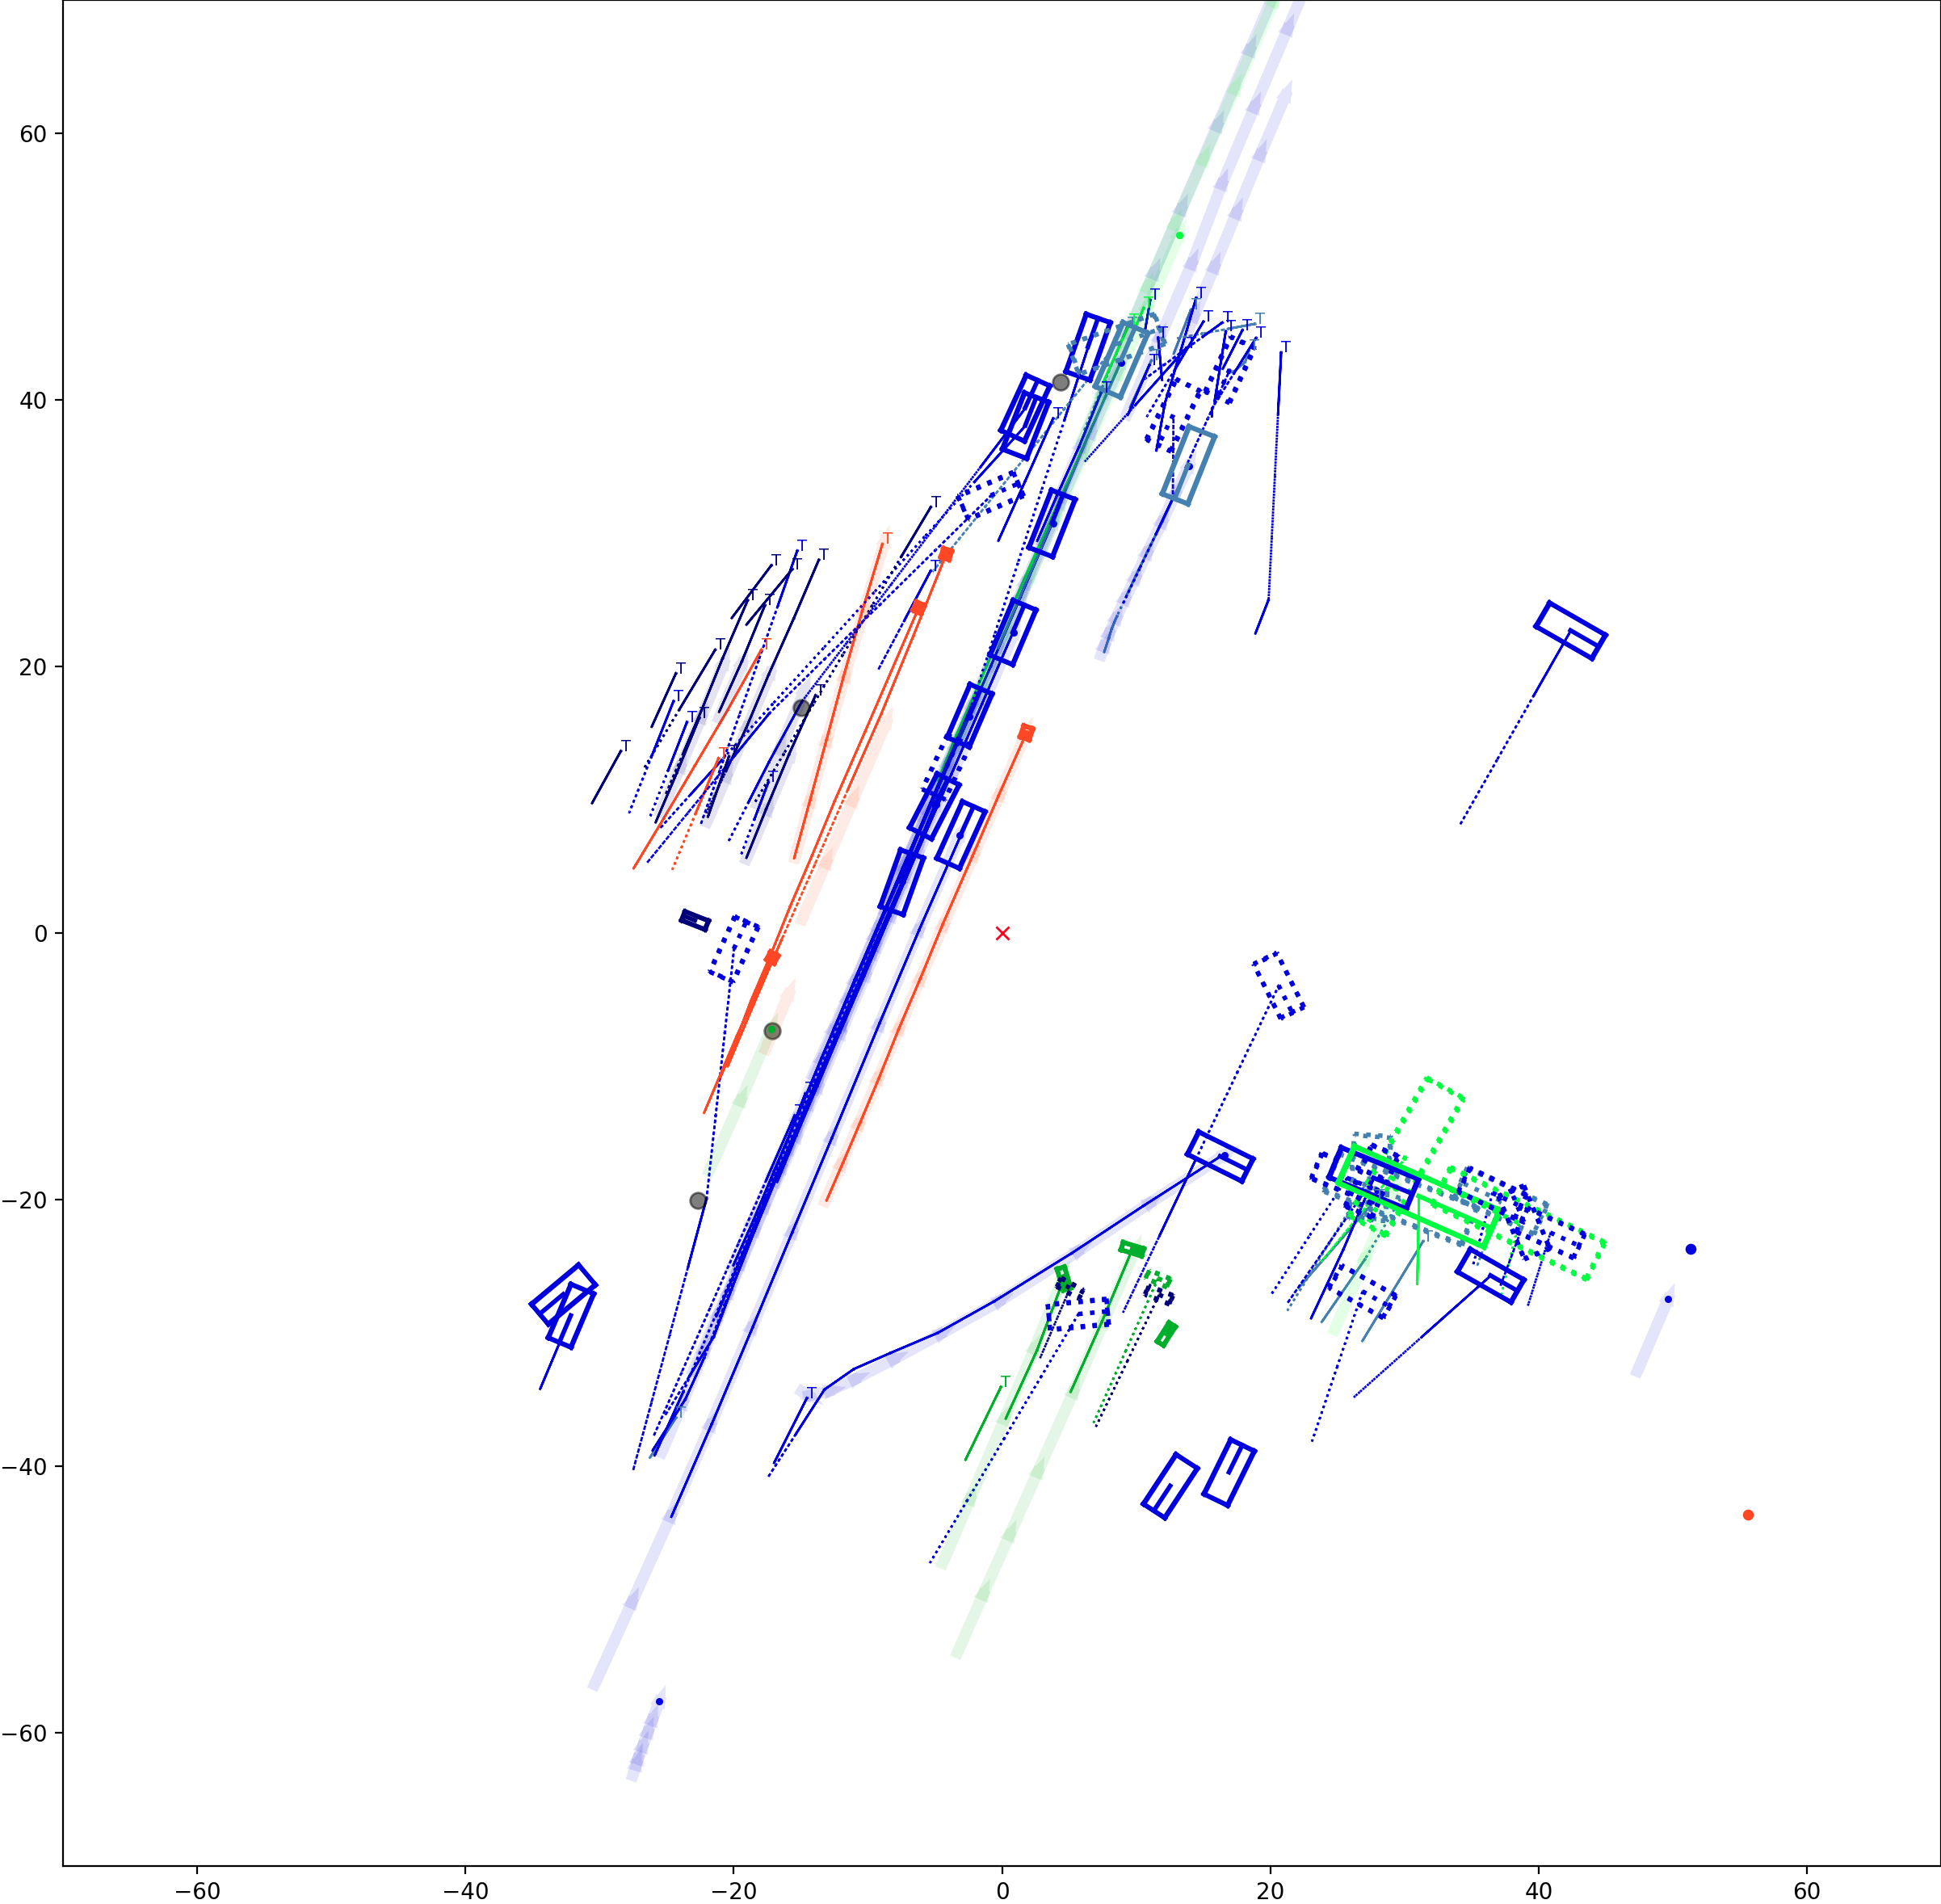
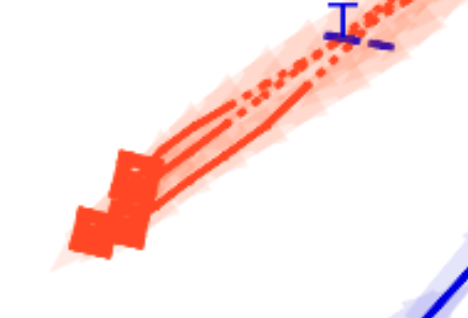
The analysis associates high birth rates with premature termination and restart. Lowering the rate to 0.001 fixes several selected examples, including this pair.
Trade-off: making new tracks less likely can also encourage incorrect associations to old tracks.
Before. Premature termination in the original experiment.After. The source reports improvement with birth rate 0.001.
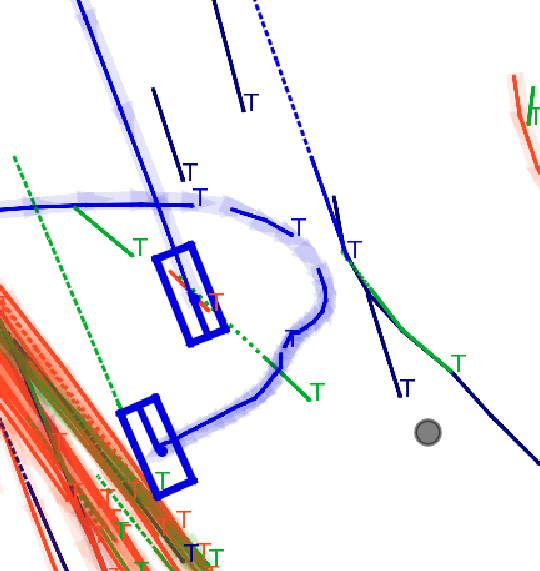
03 · Motion mismatch
Turning remains difficult after tuning.
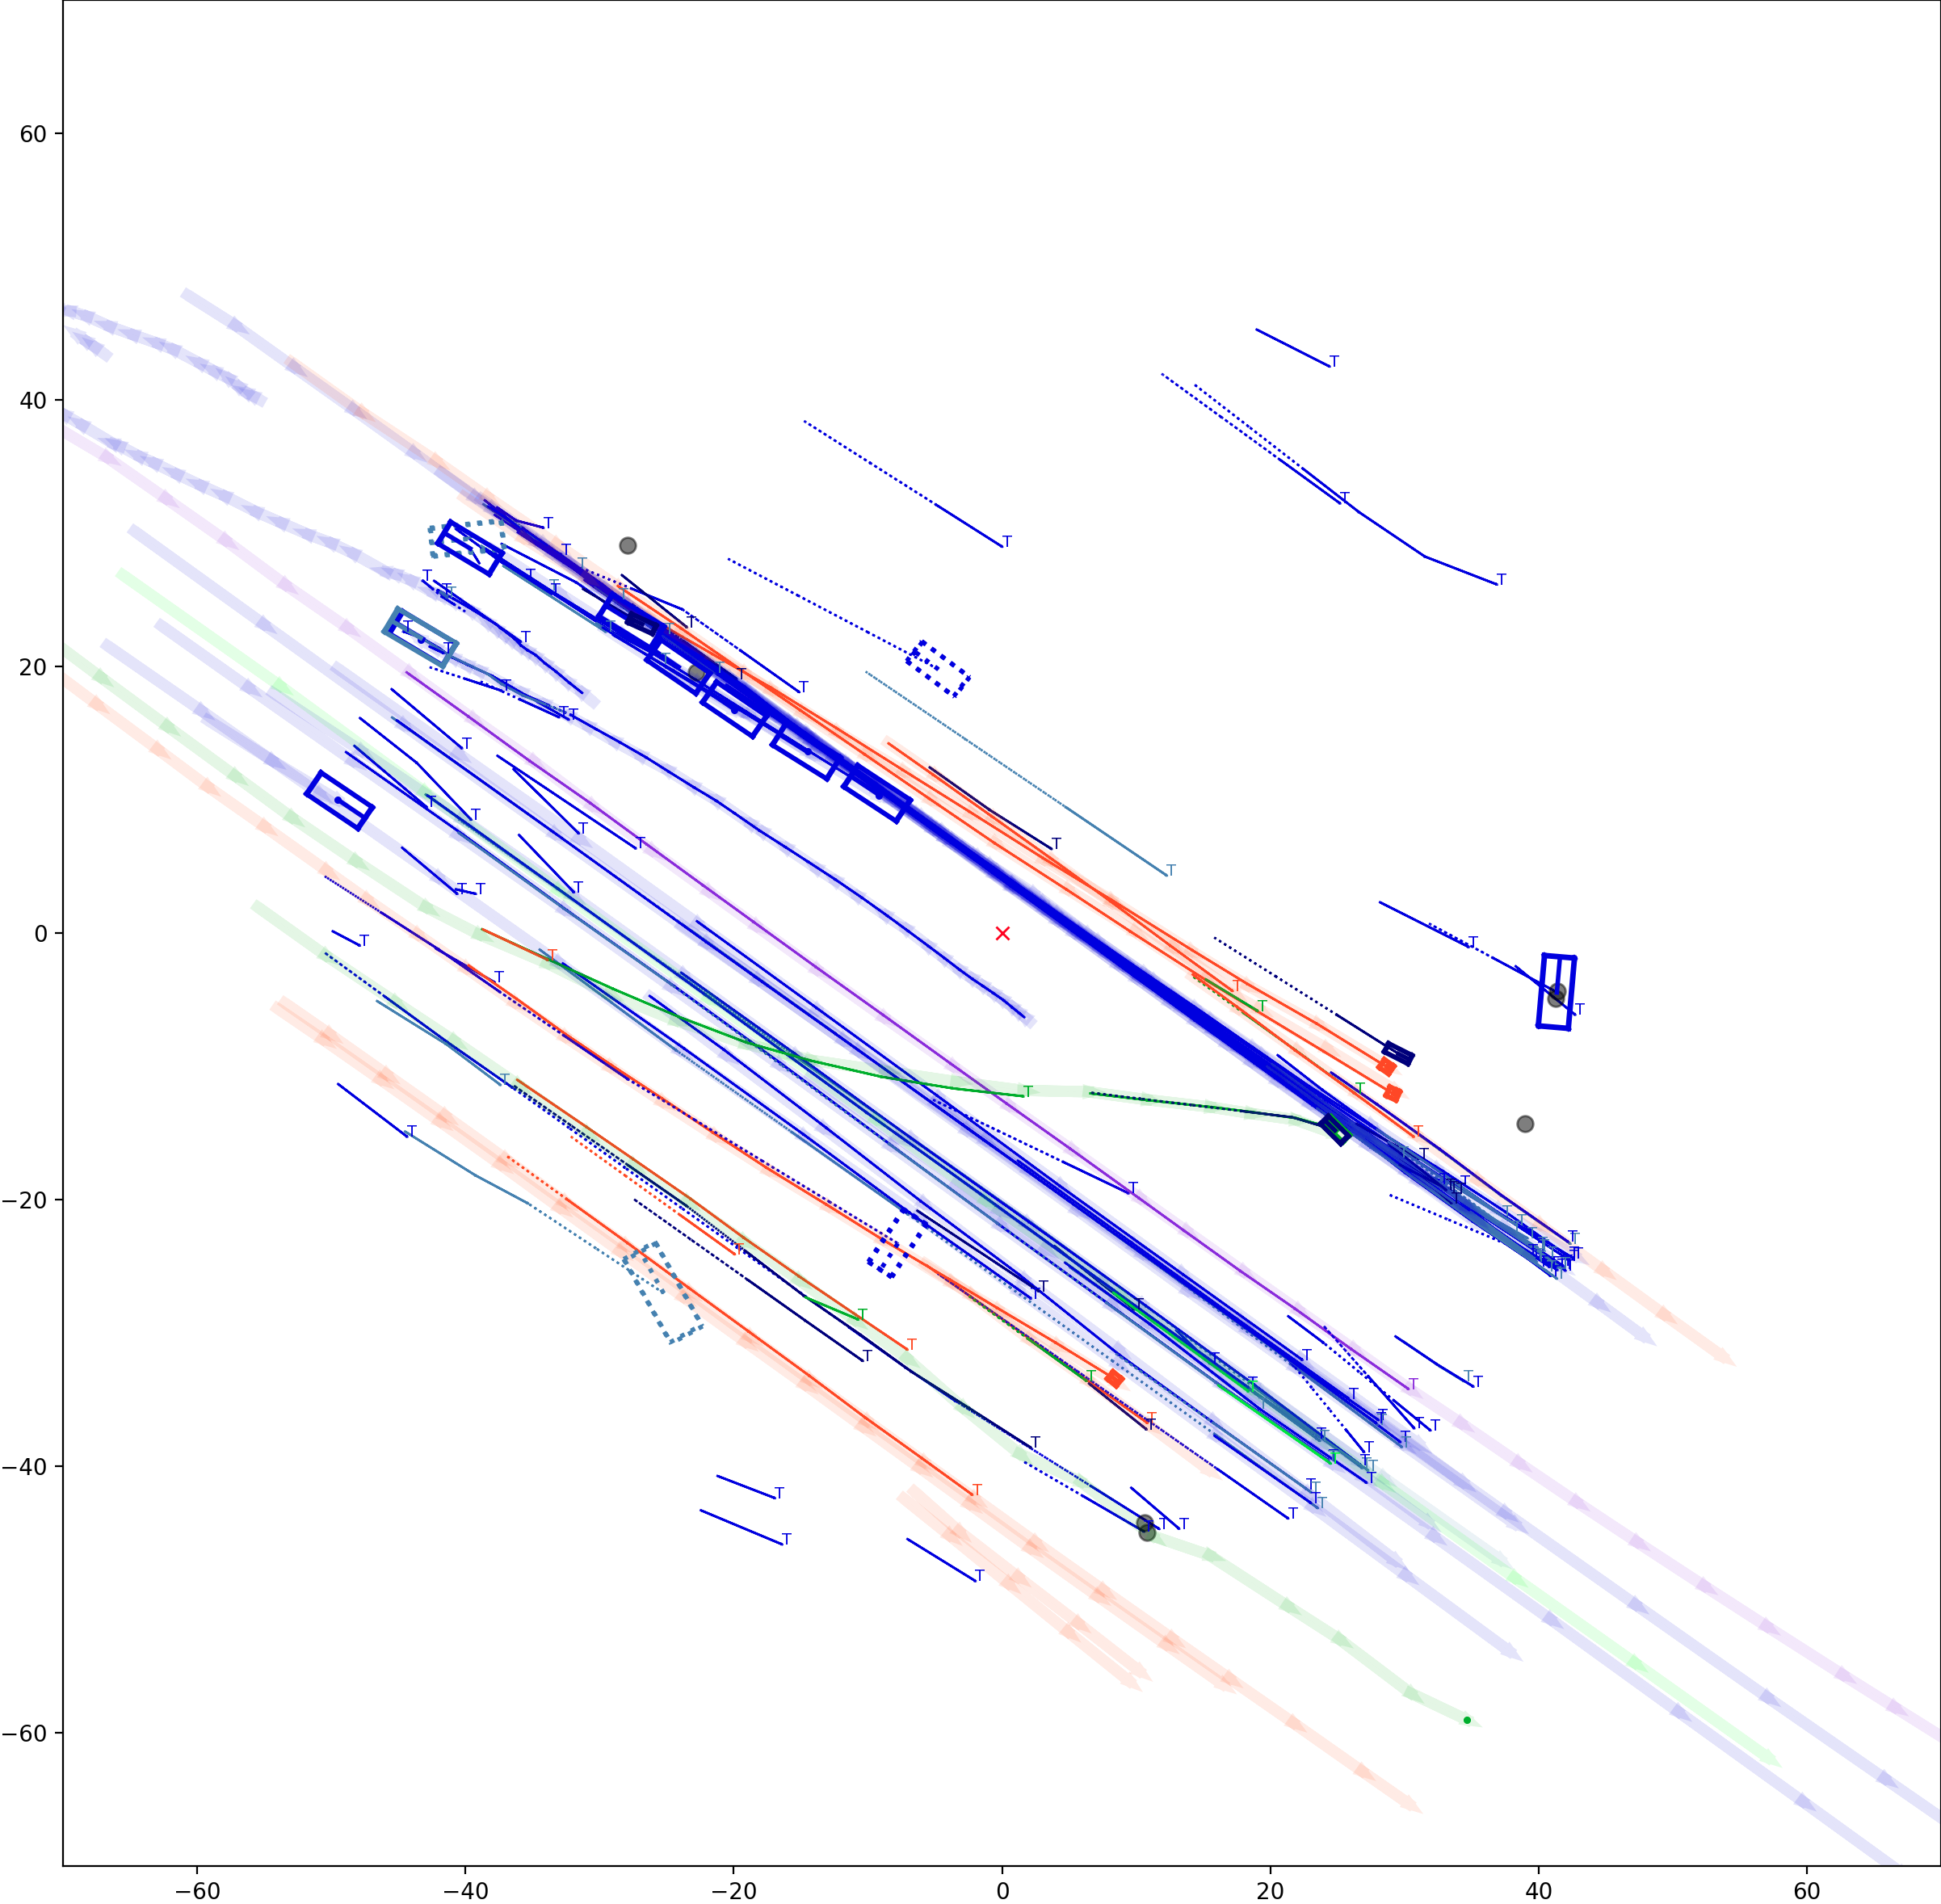
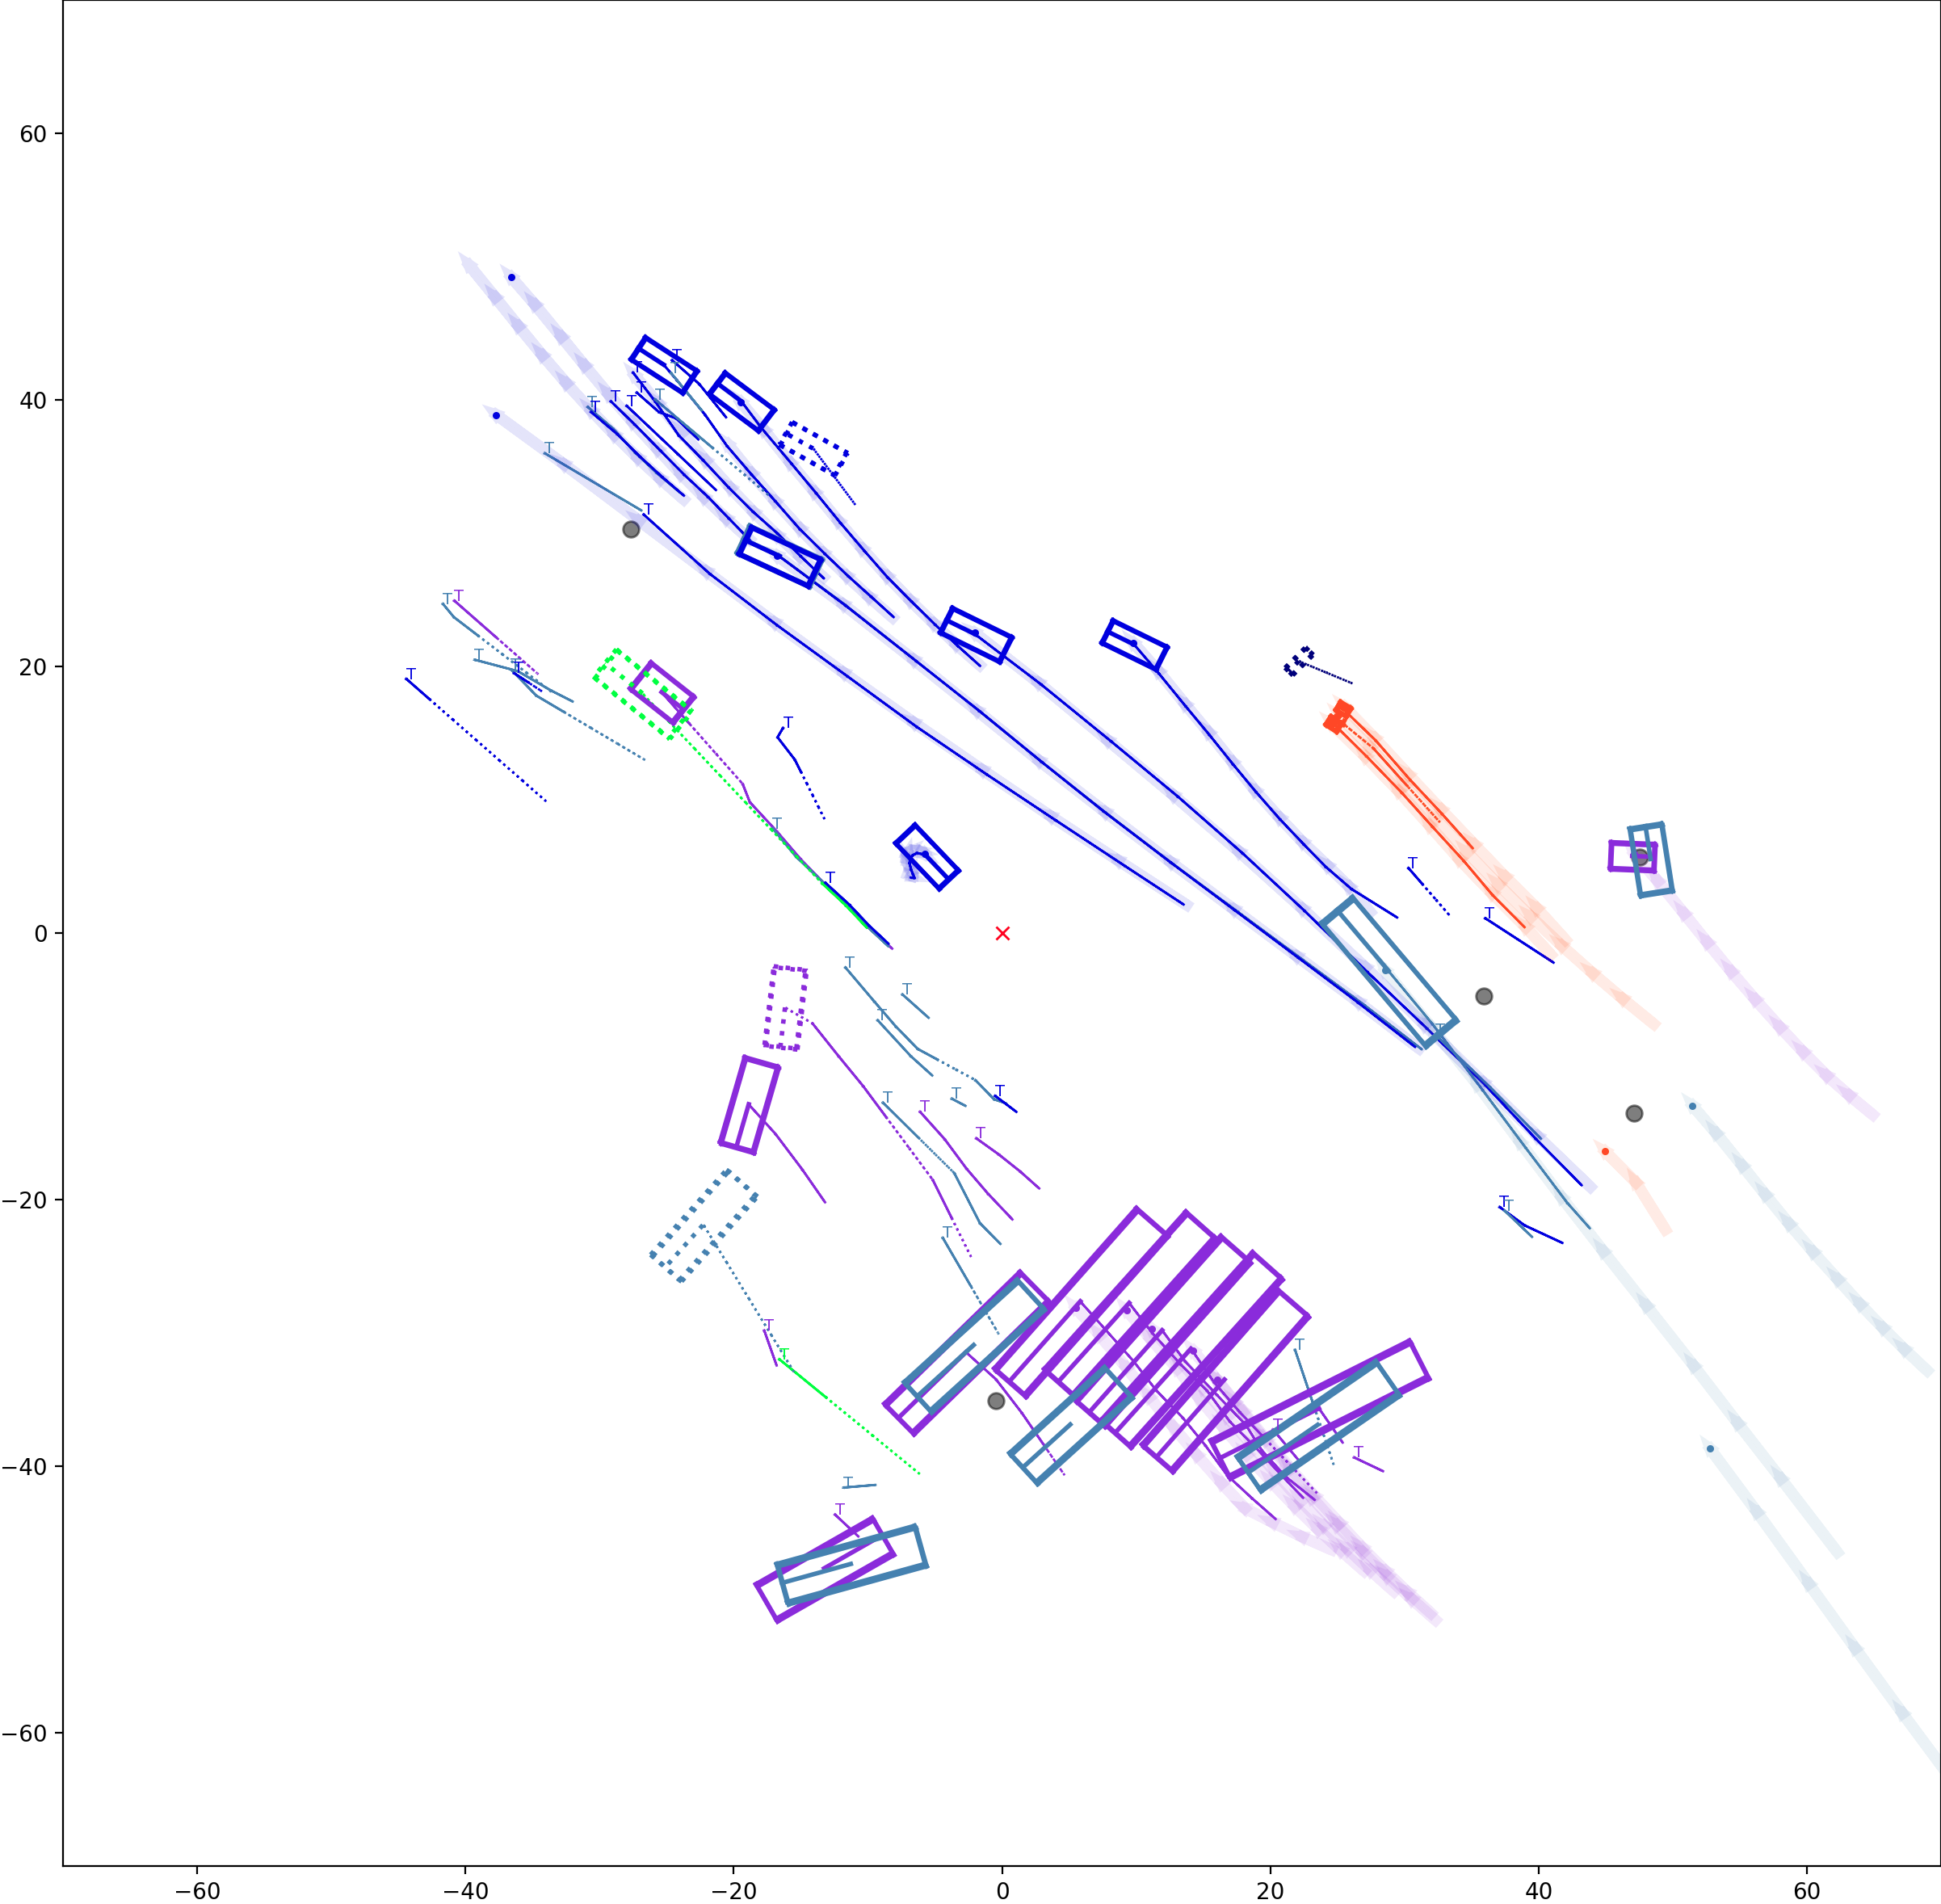
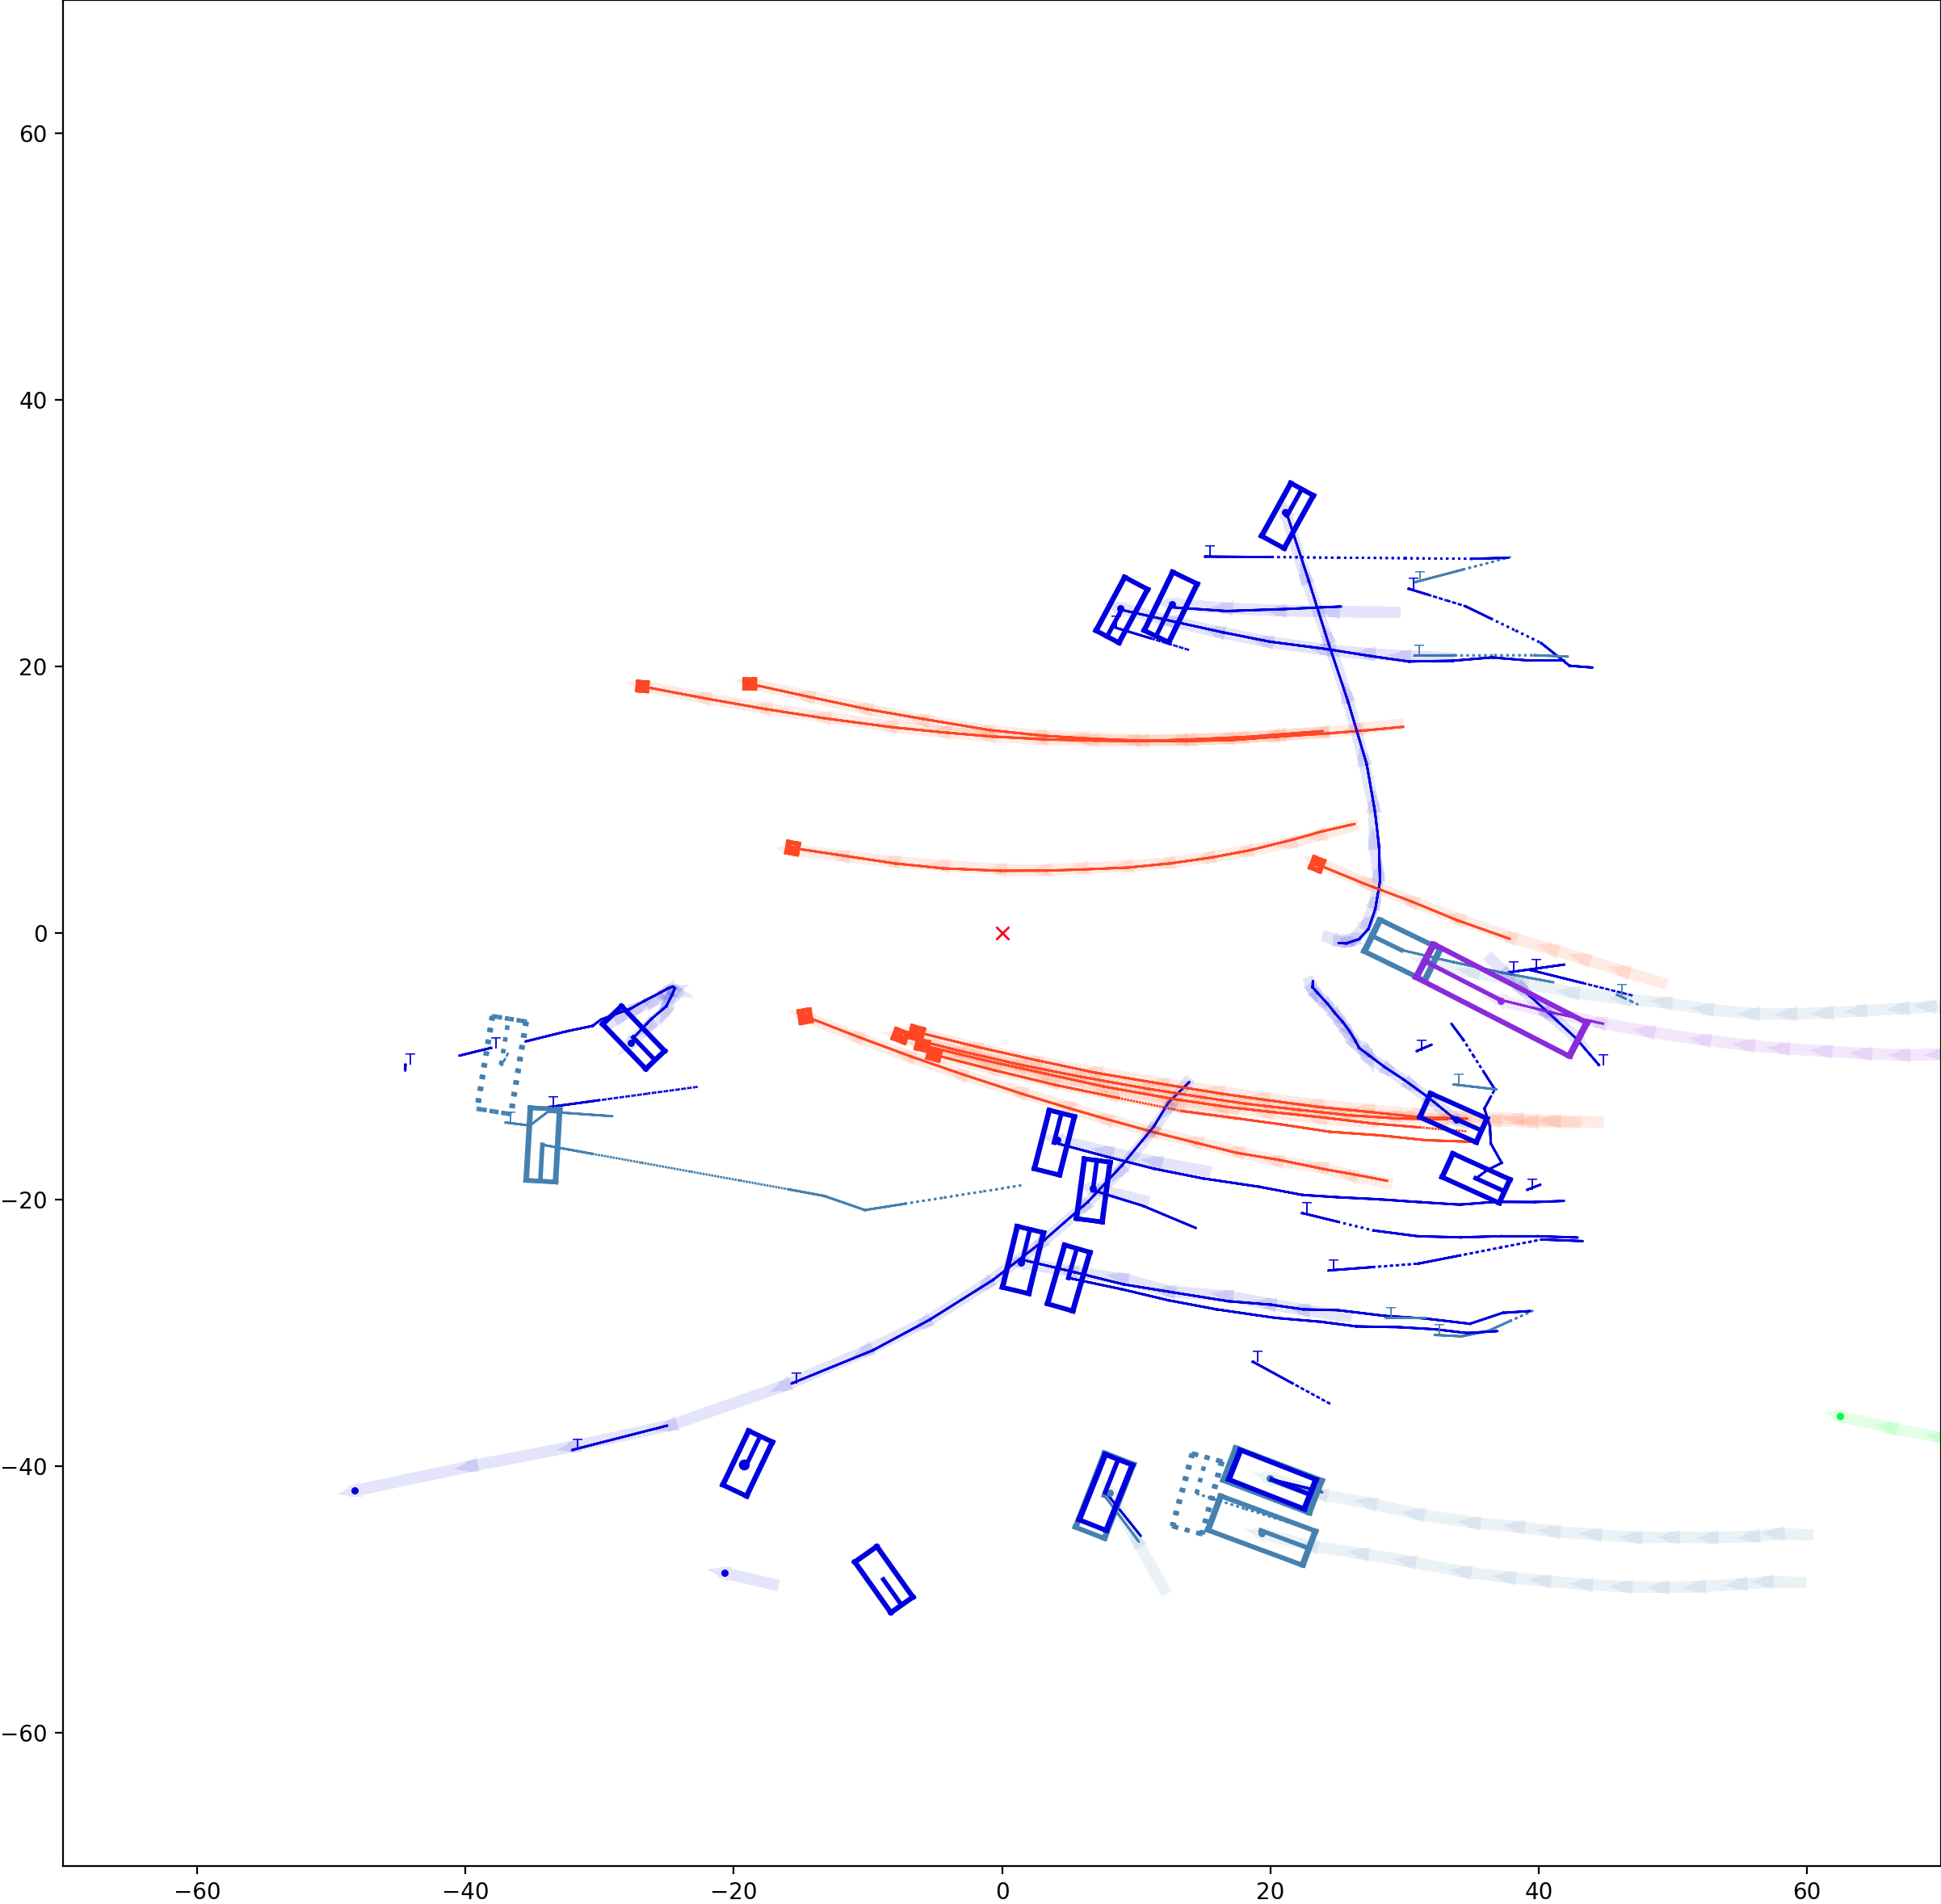
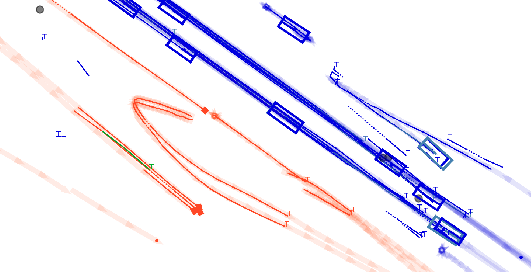
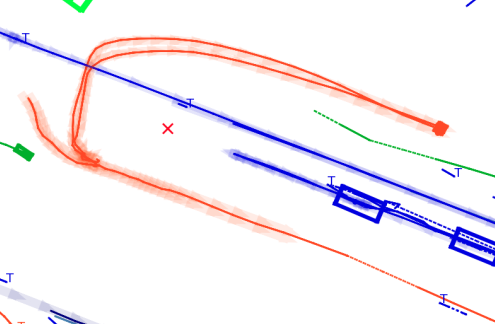
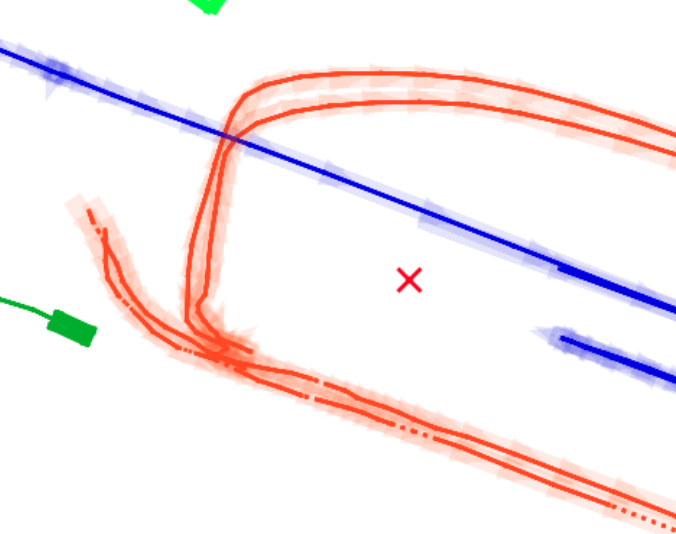
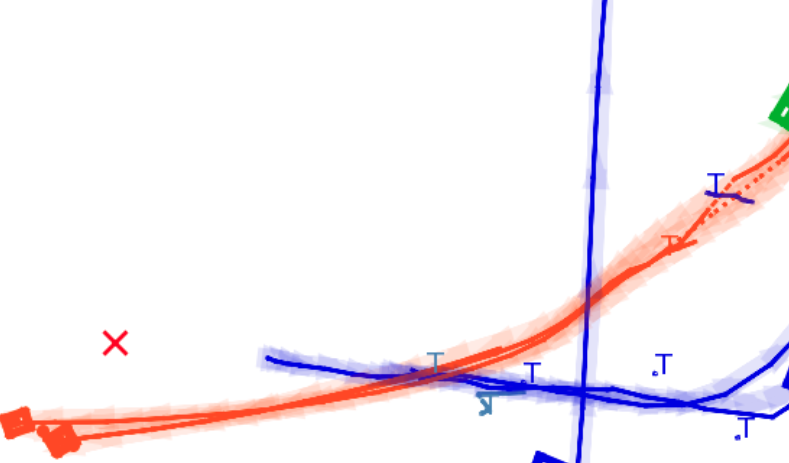
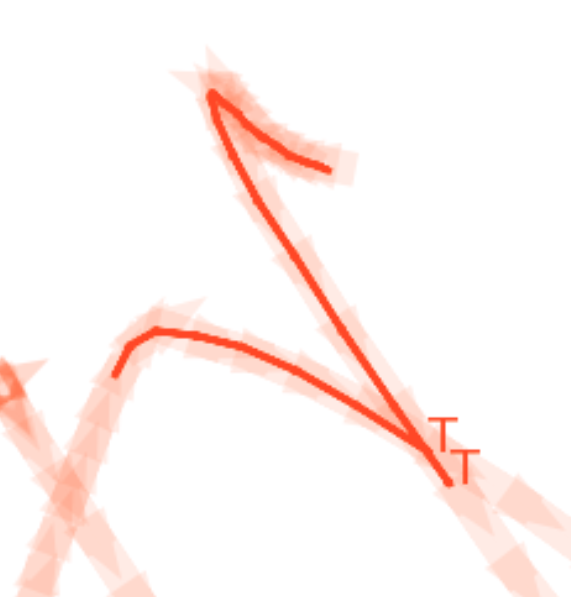
Several examples terminate during a curved trajectory. One caption explicitly notes that the problem remains after radar velocity is added.
Hypothesis to test: a motion model that better represents turns may help where changing only the birth rate does not.
The source reports termination while turning, even with radar velocity added.
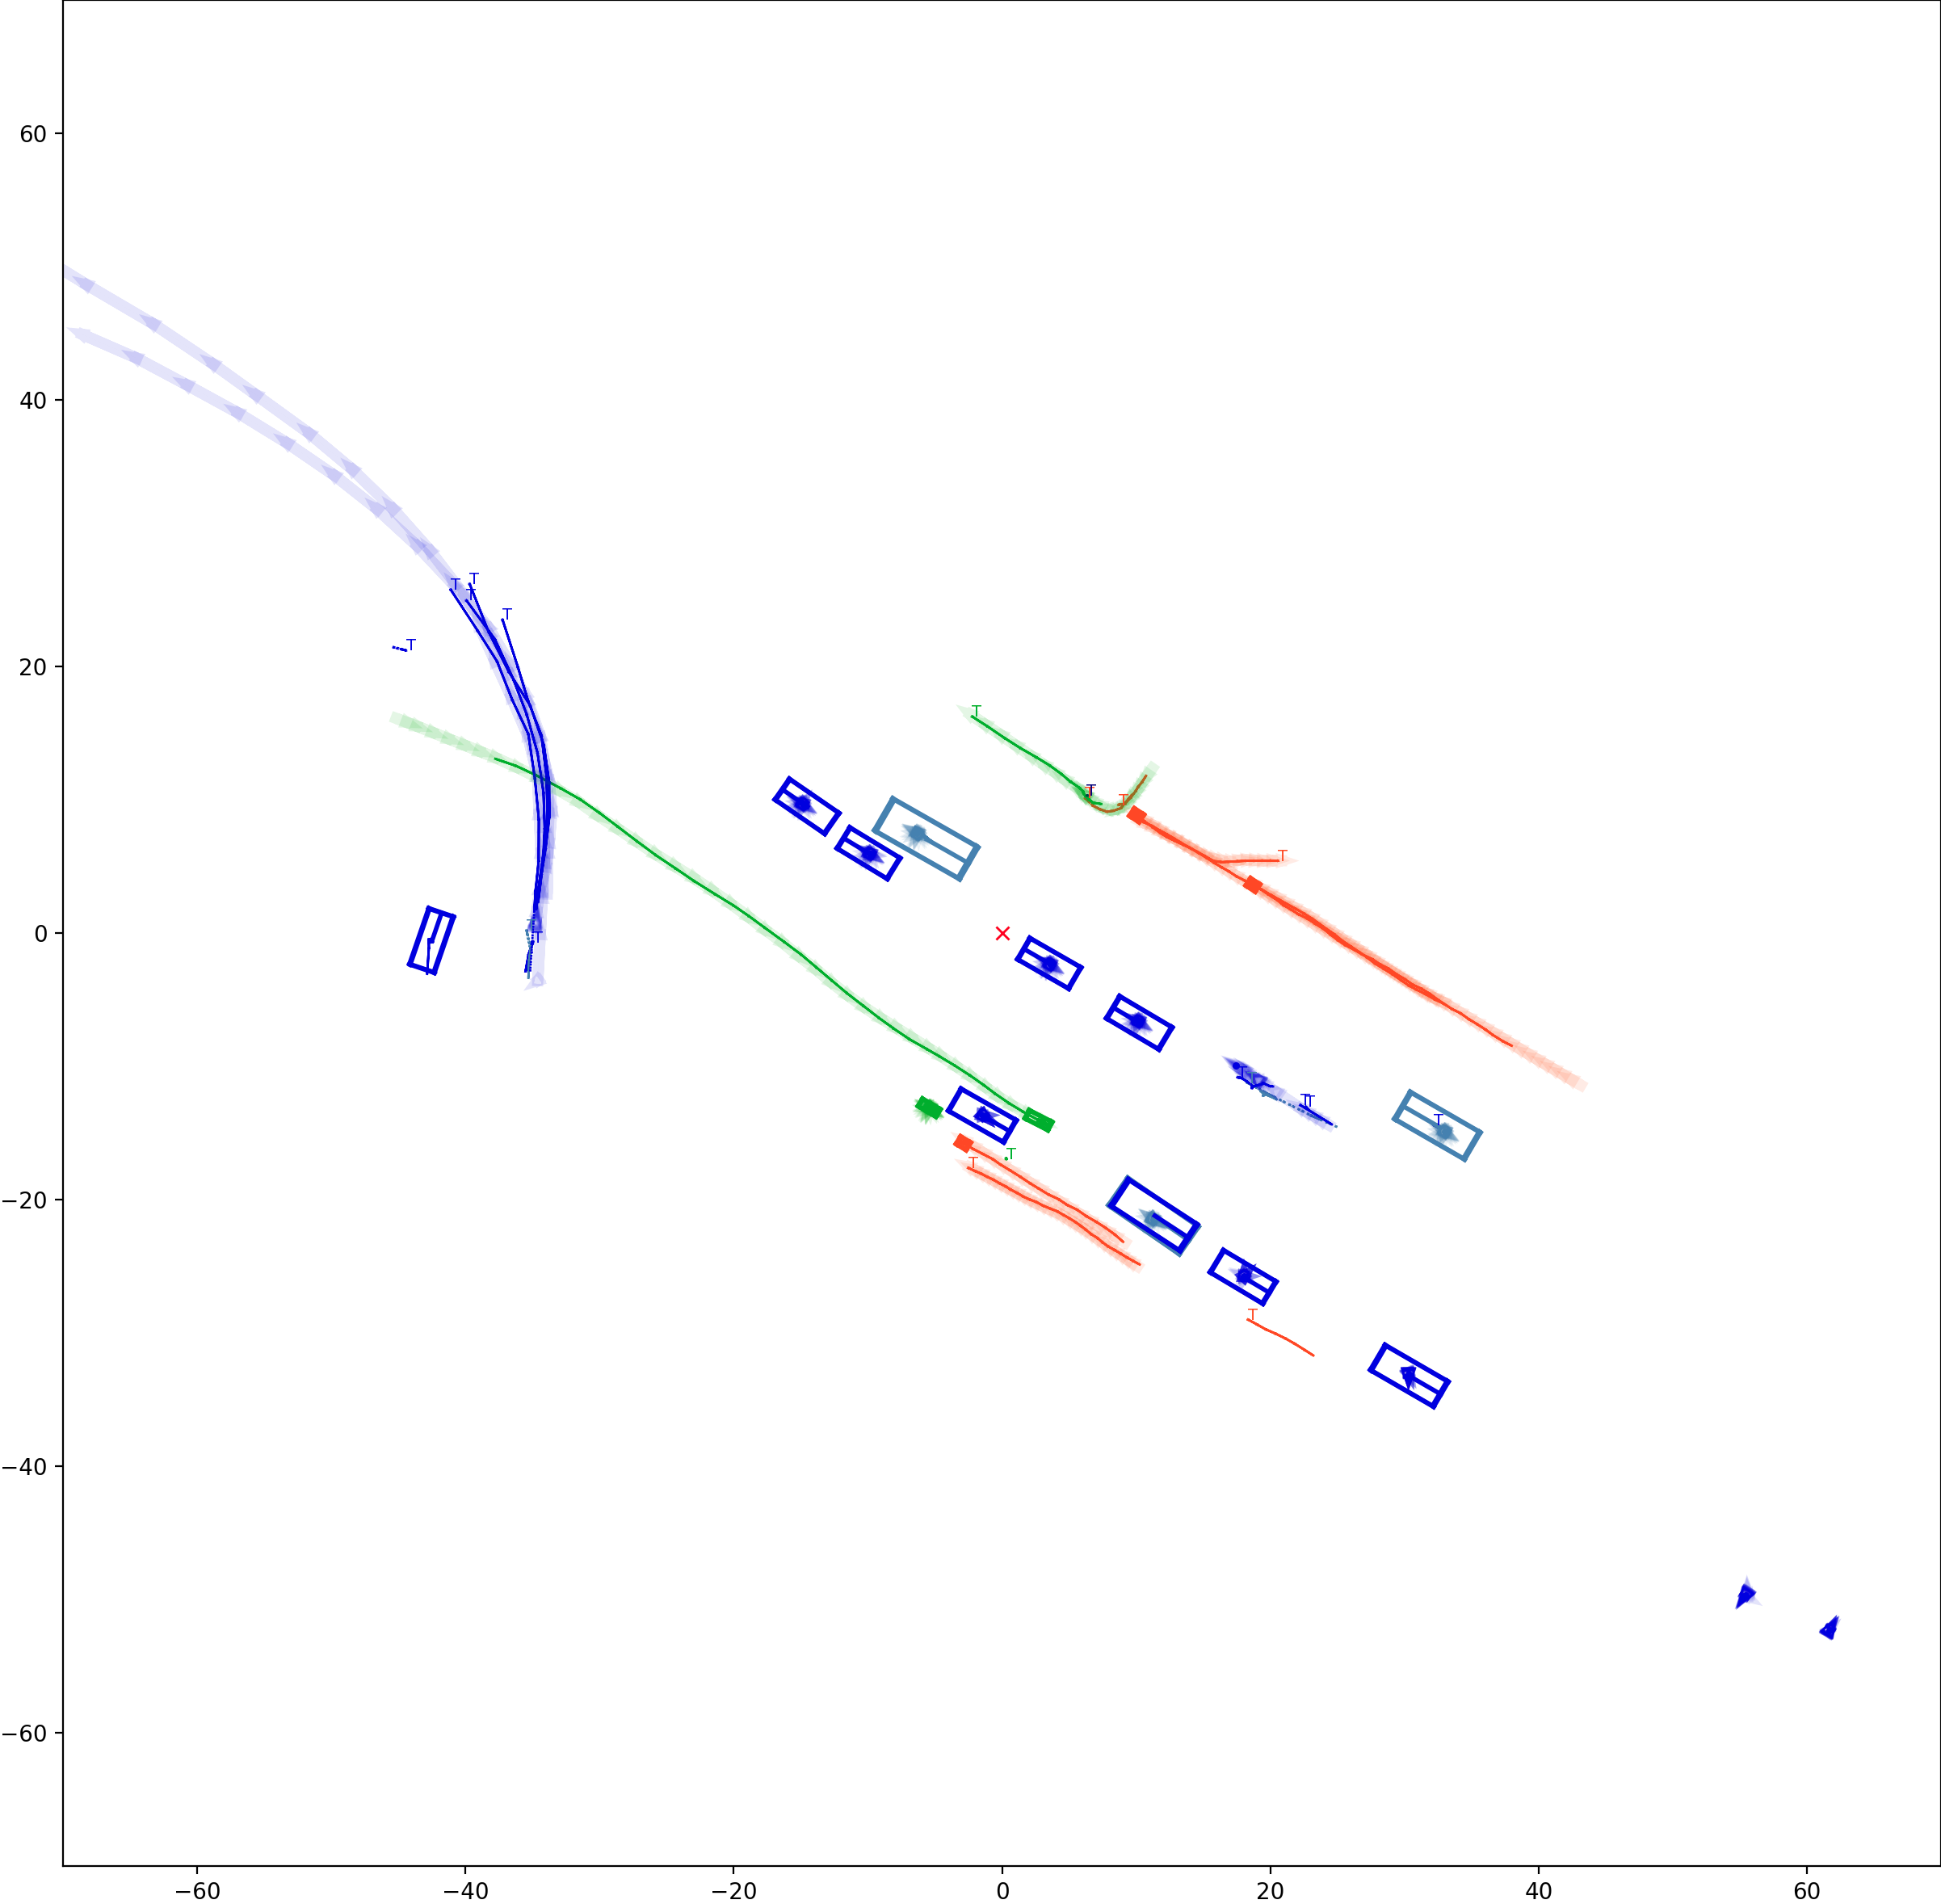
04 · Unstable class labels
The object persists. Its detection label changes.
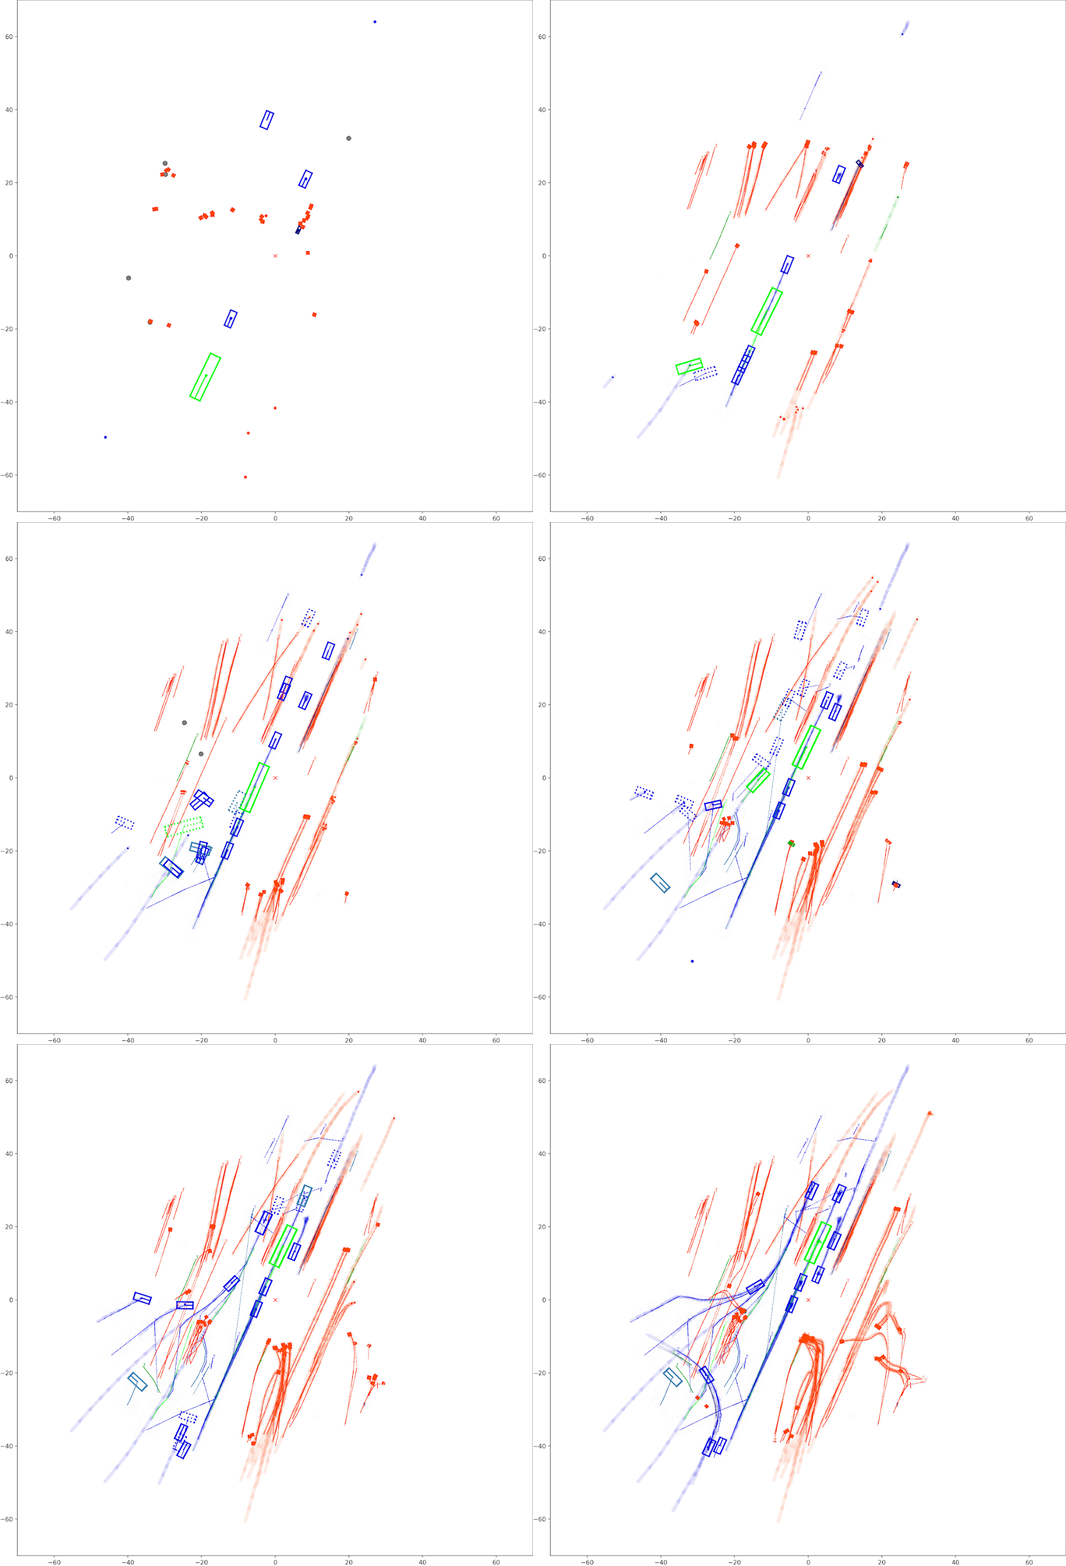
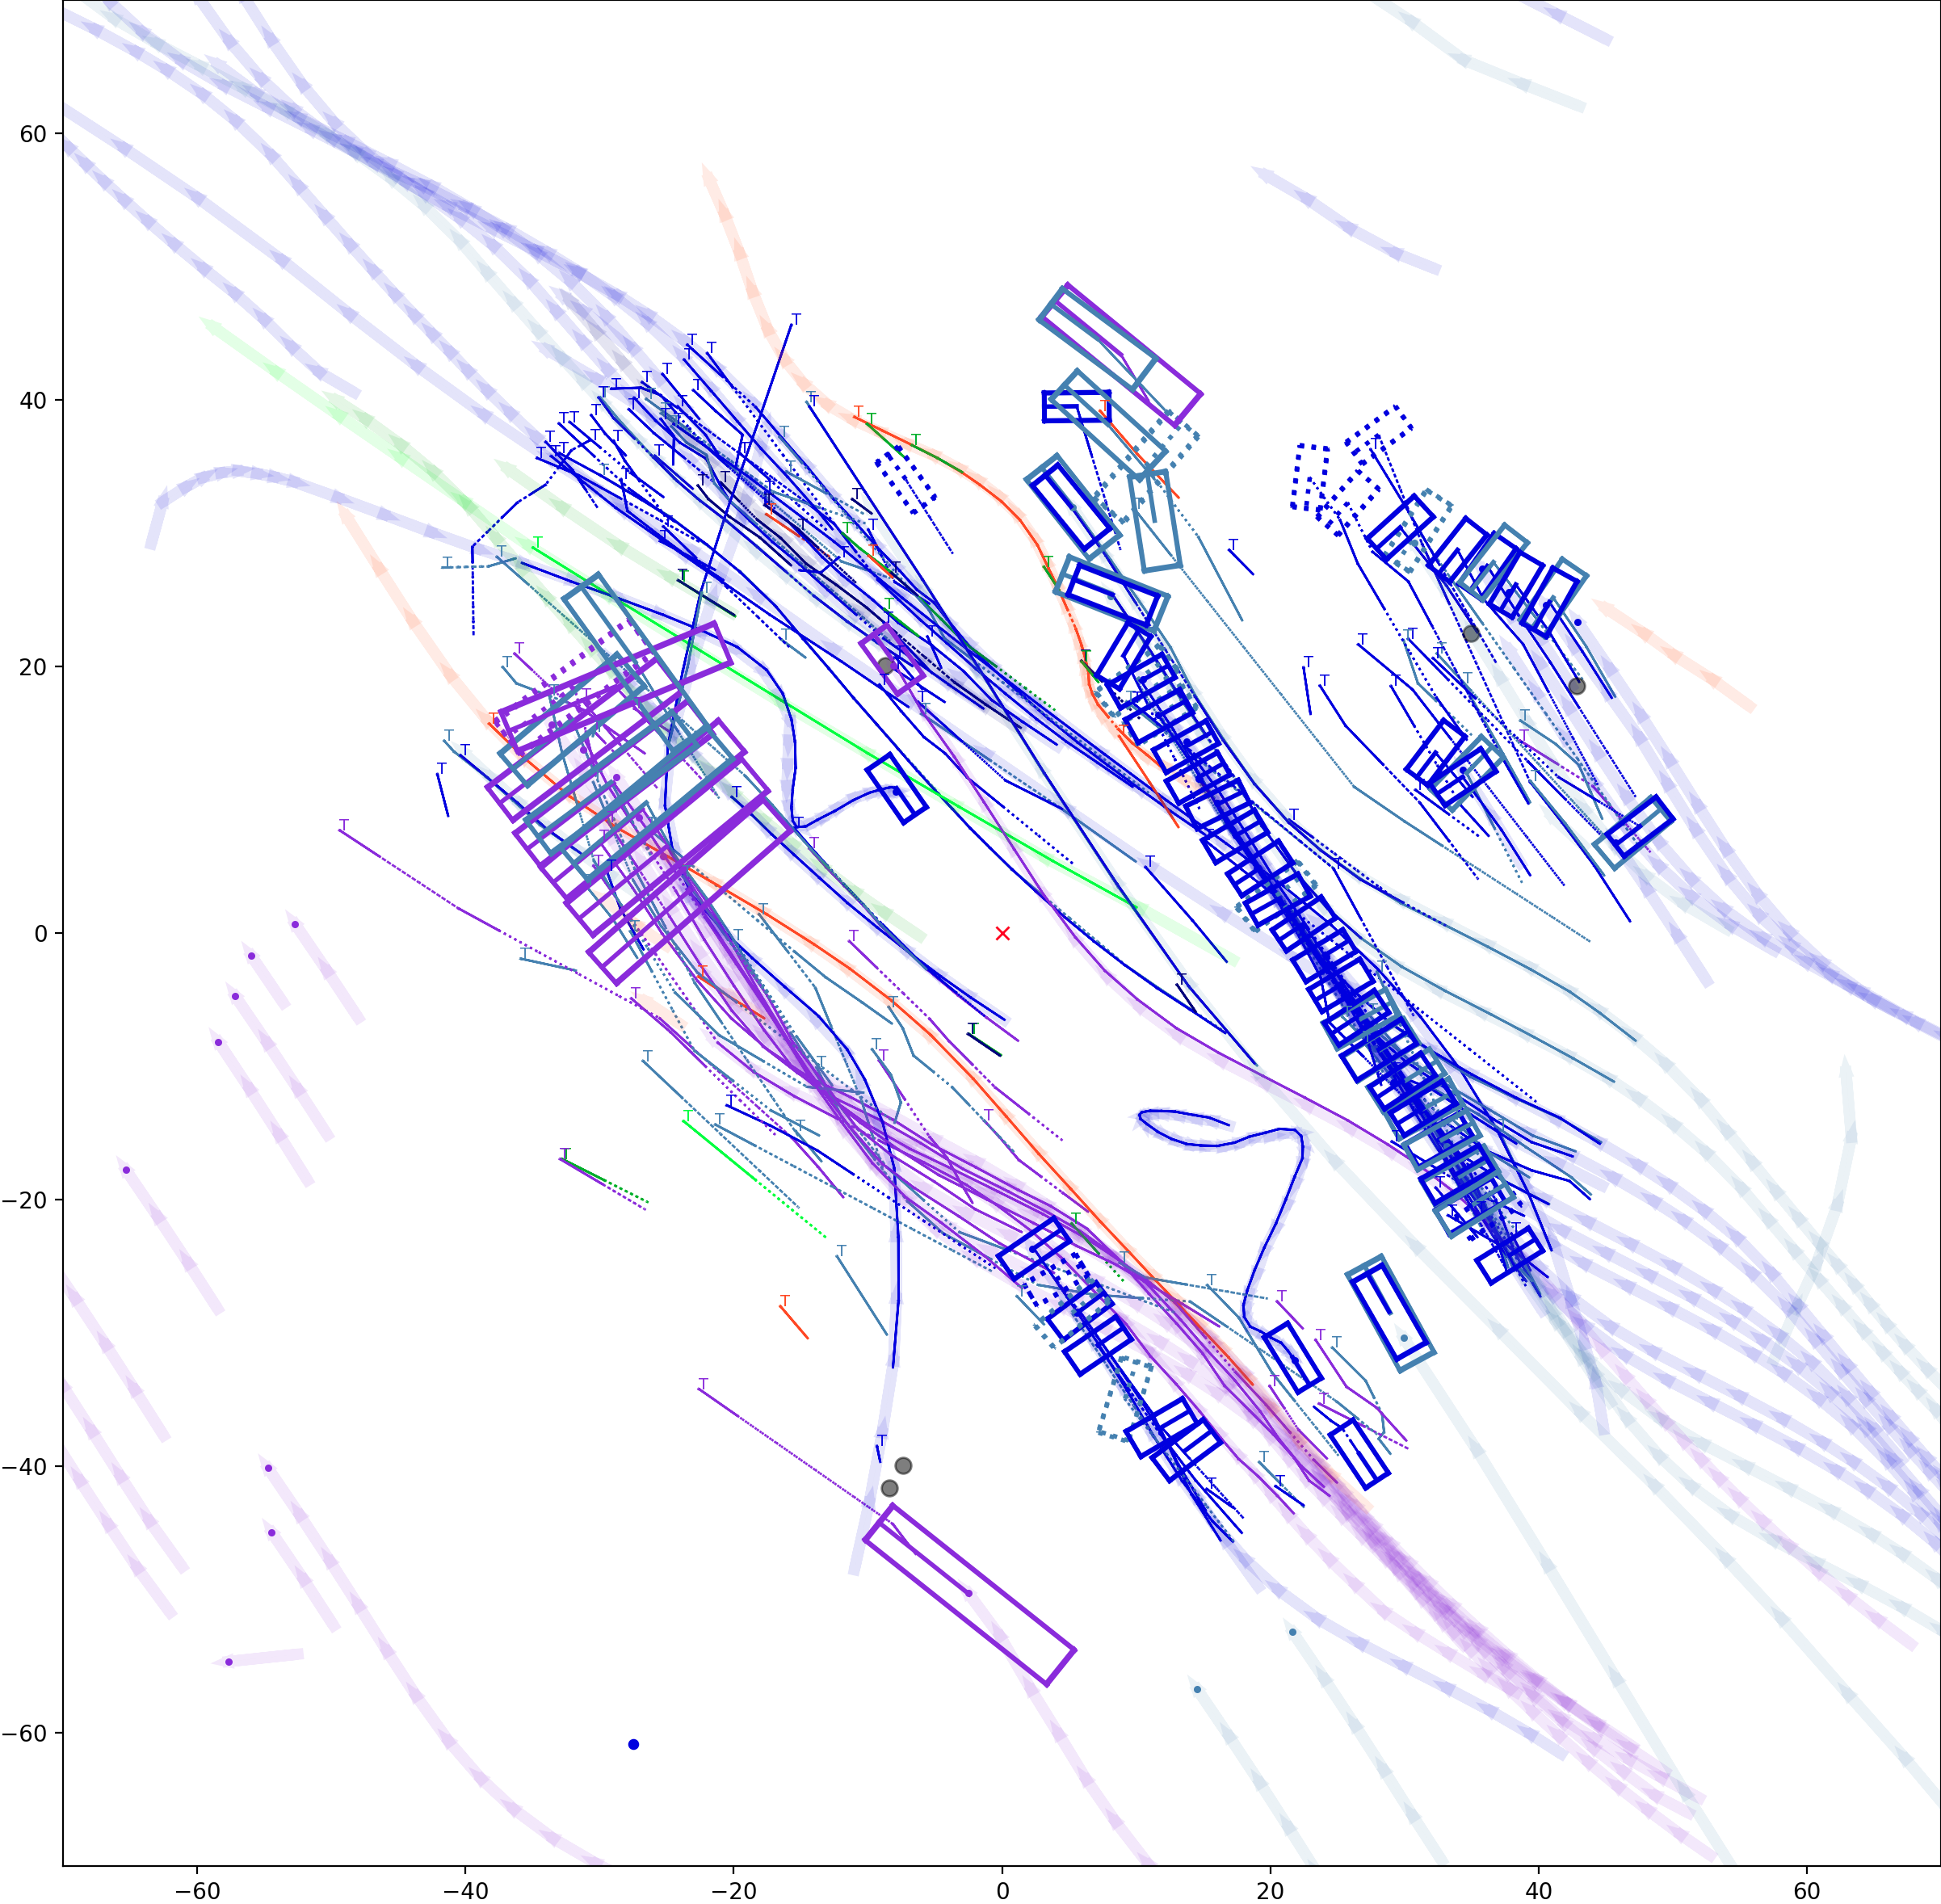
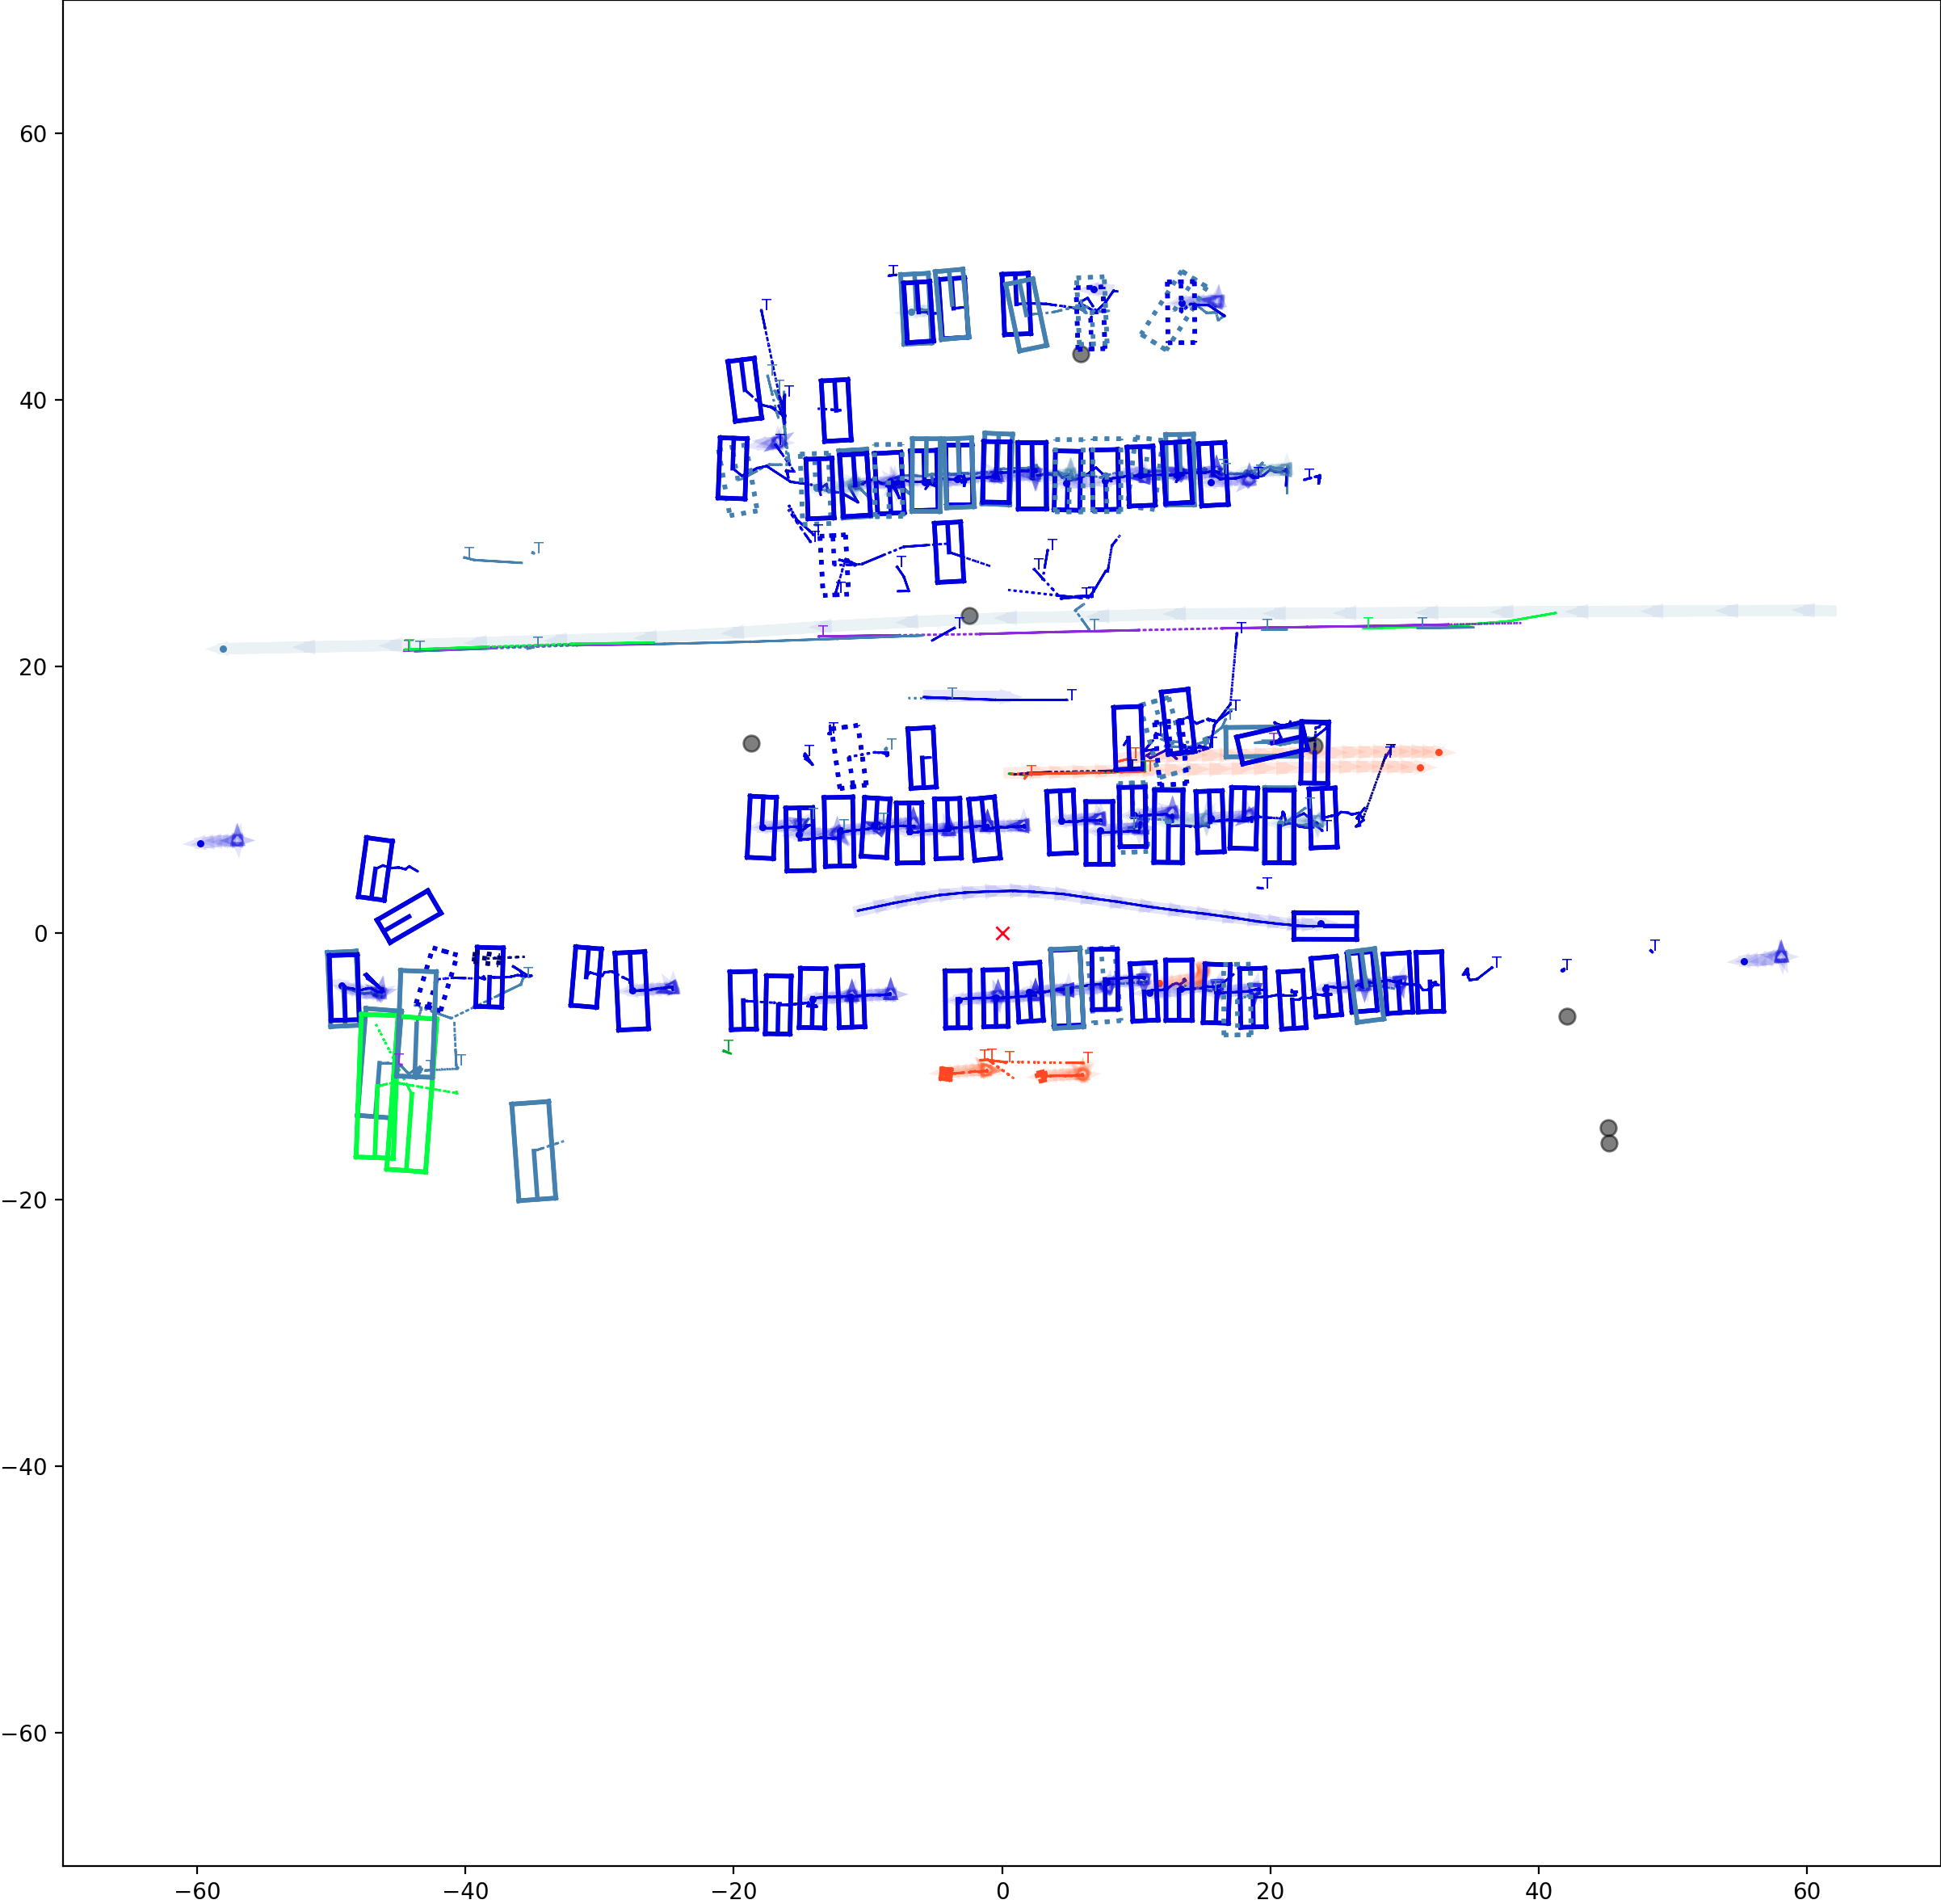
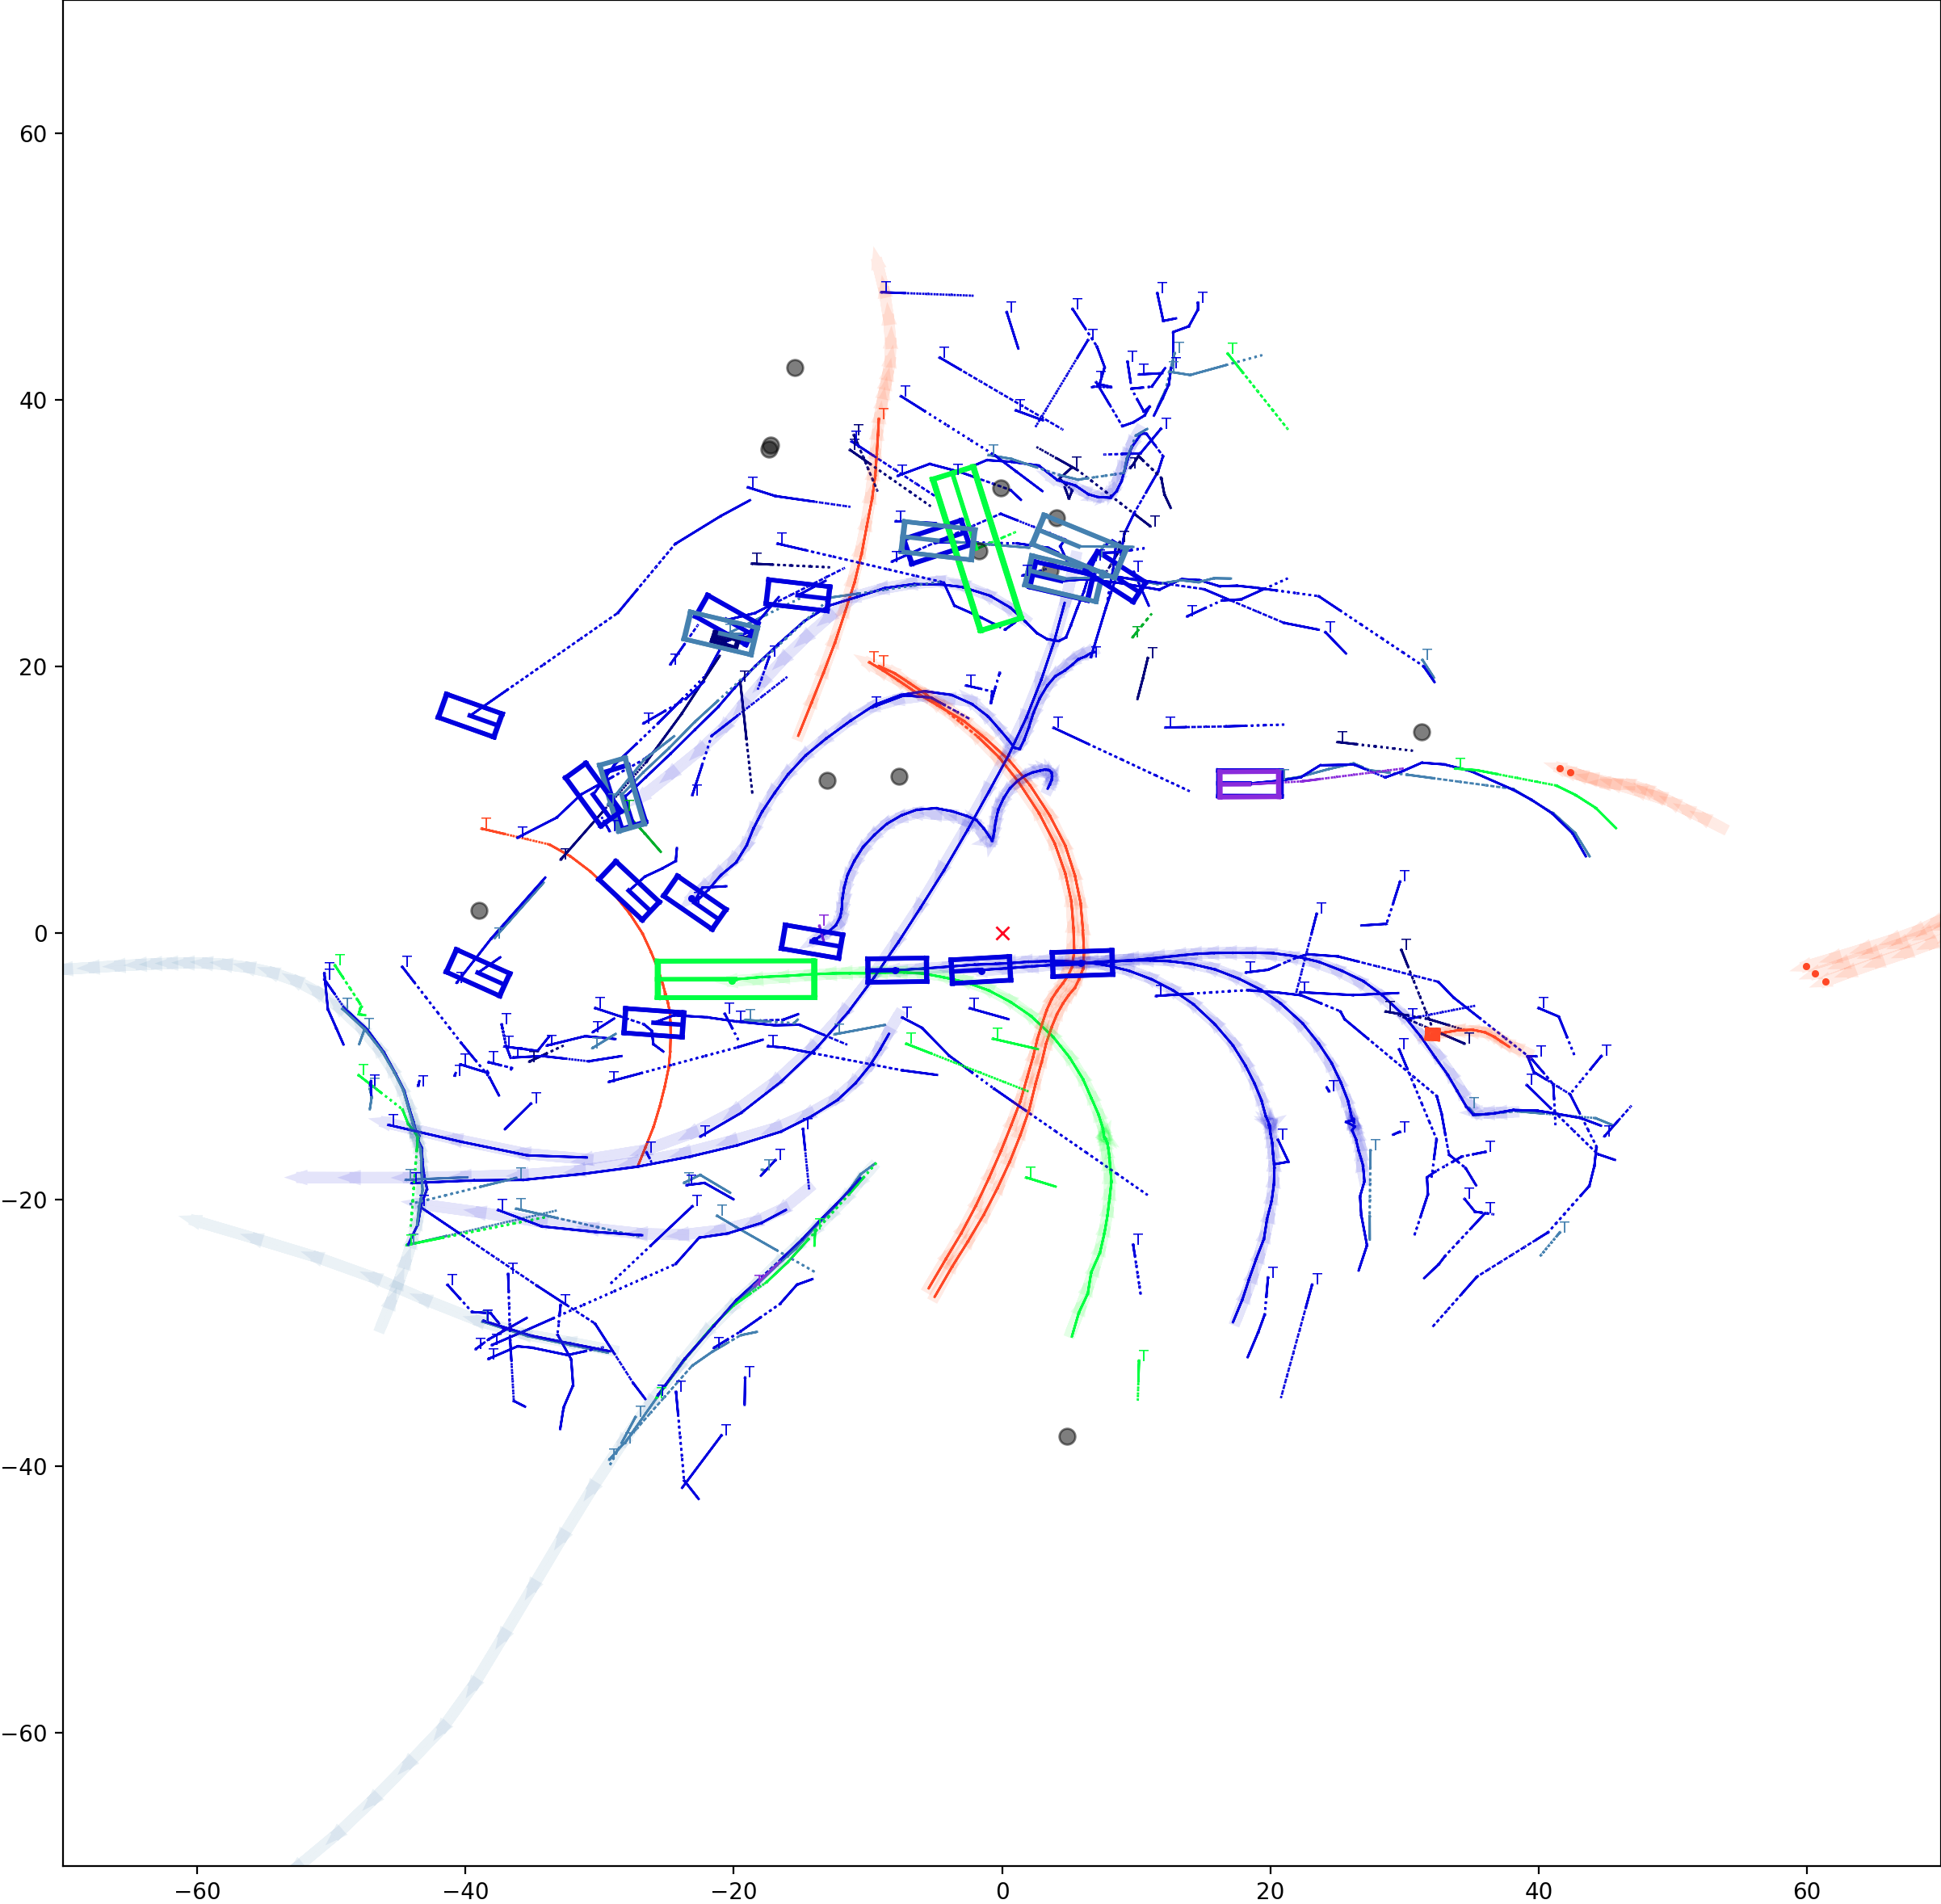
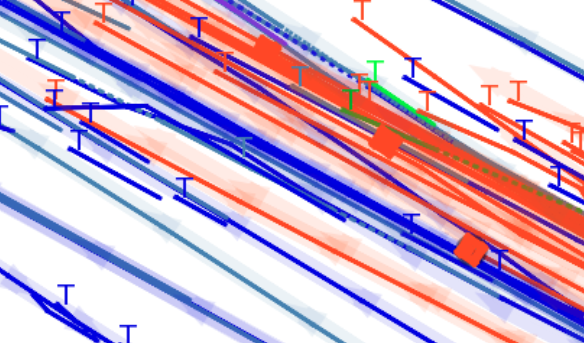
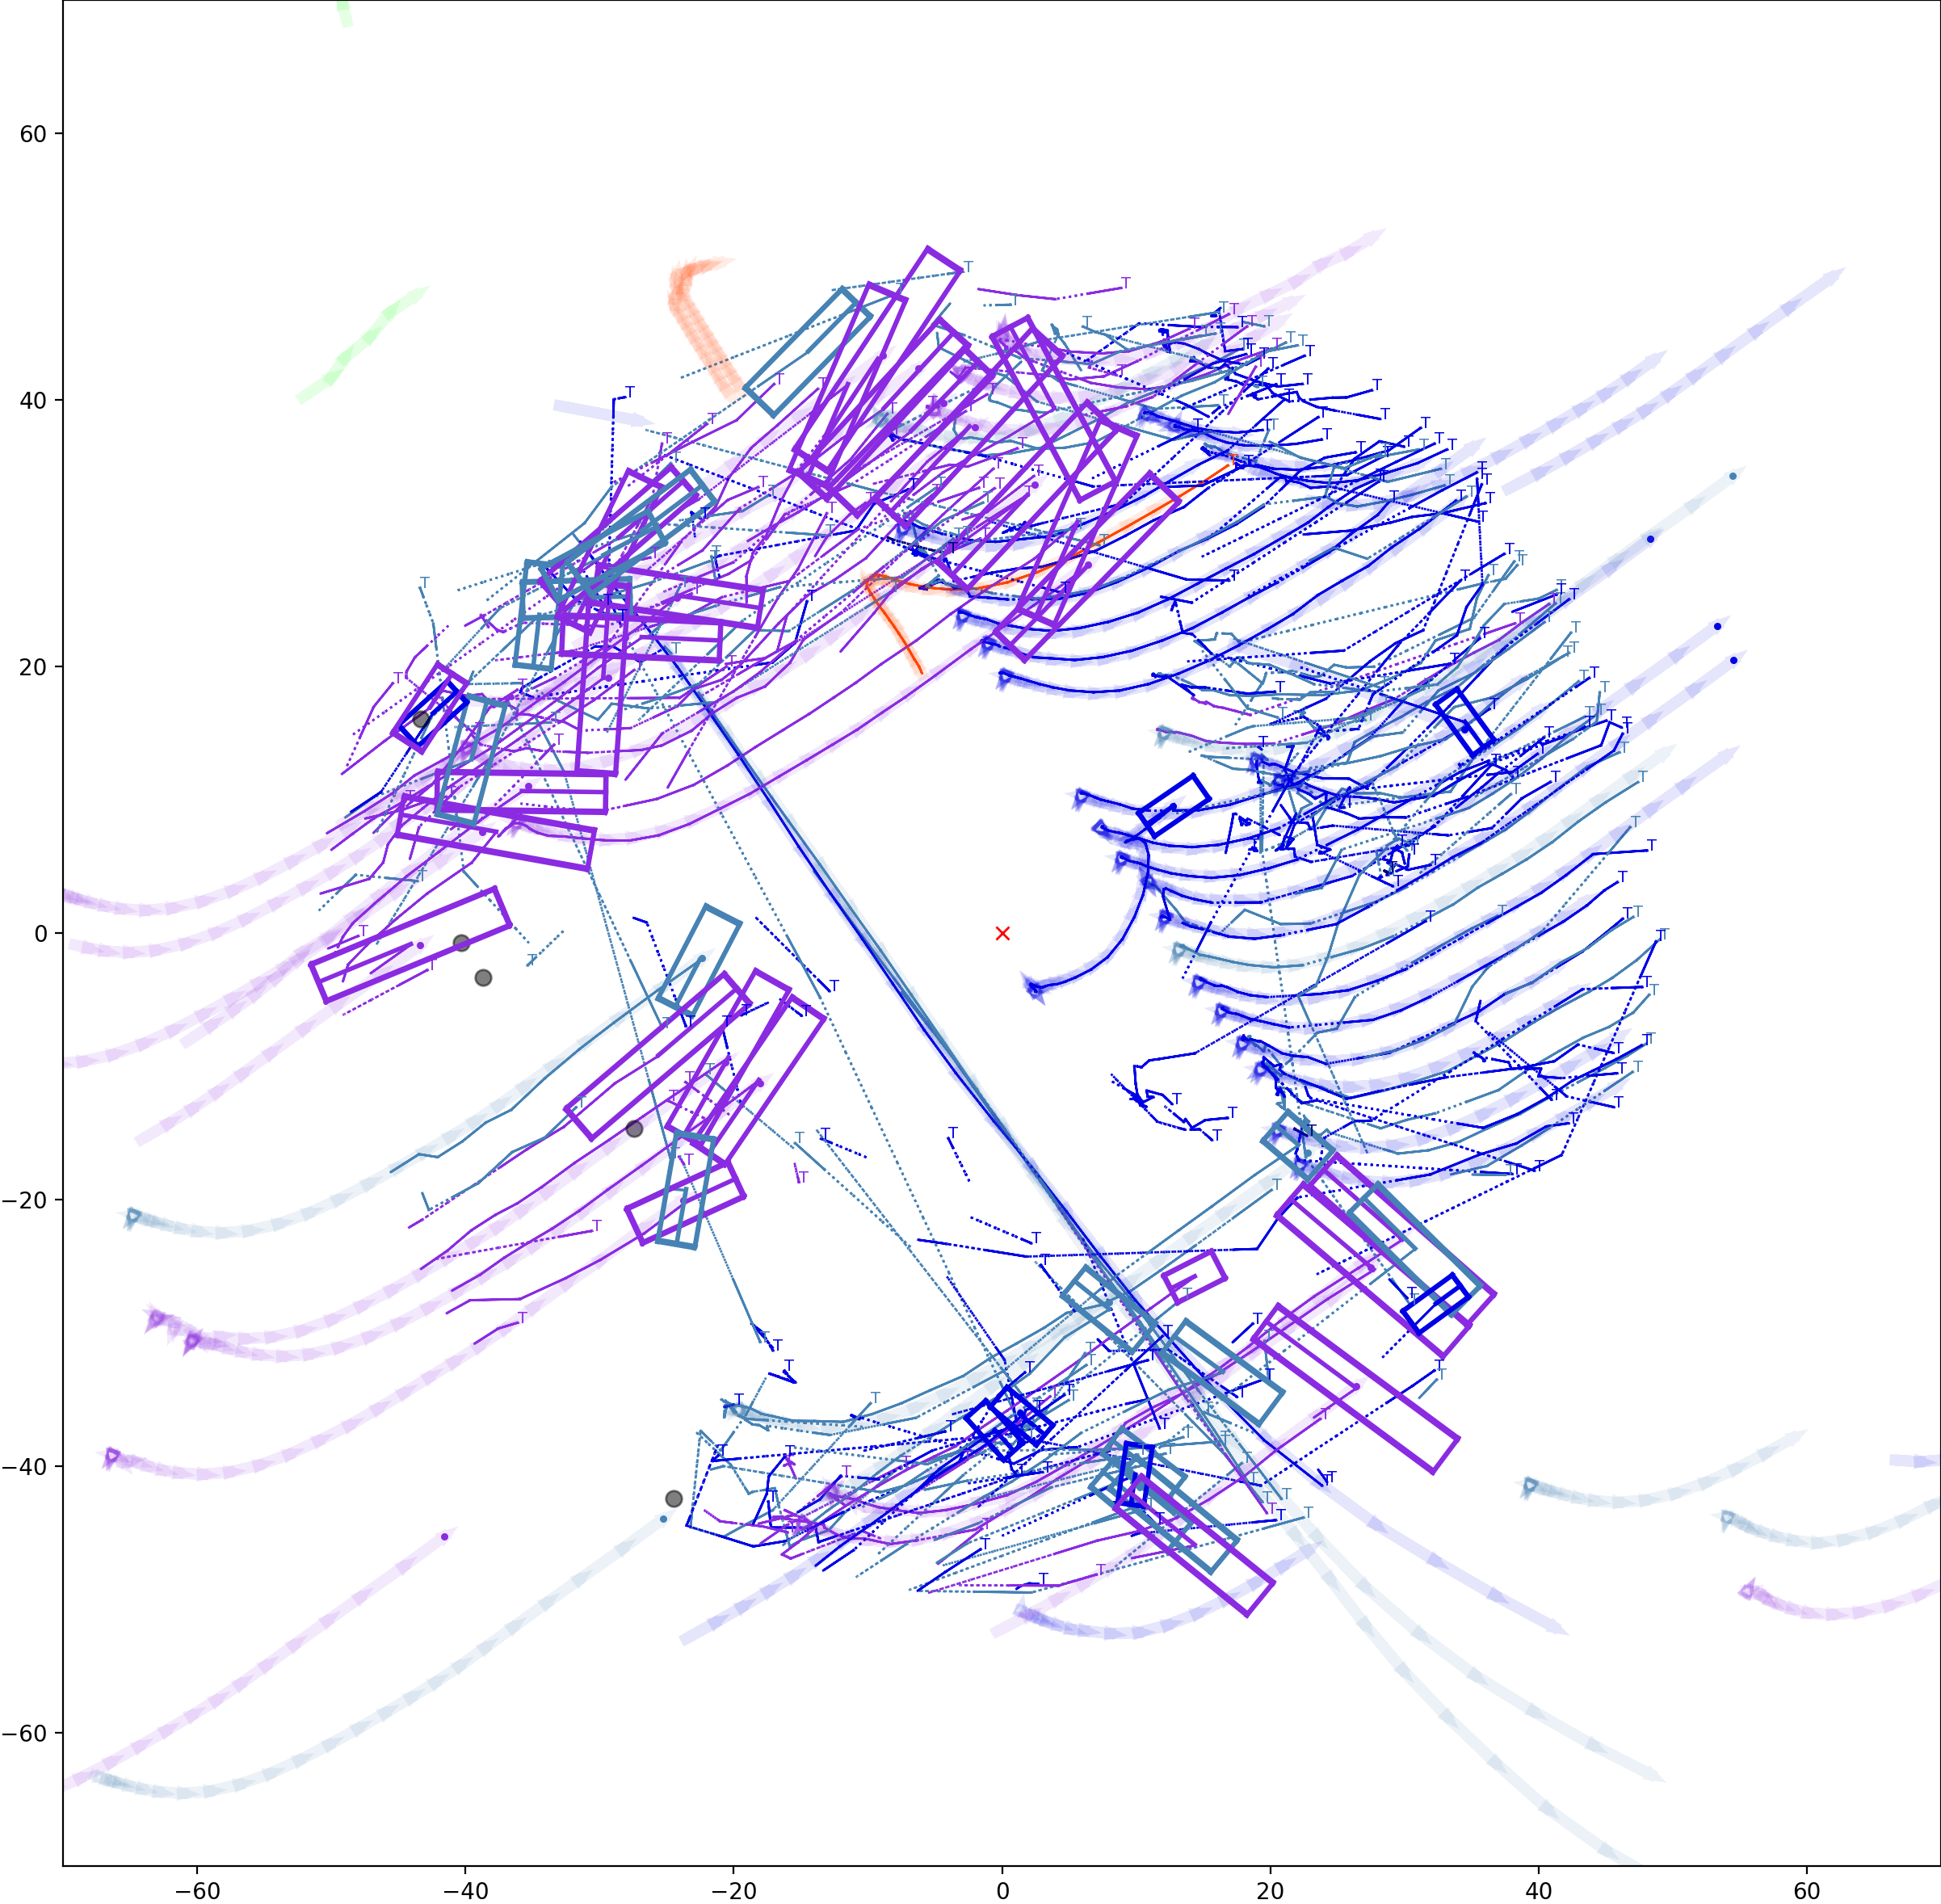
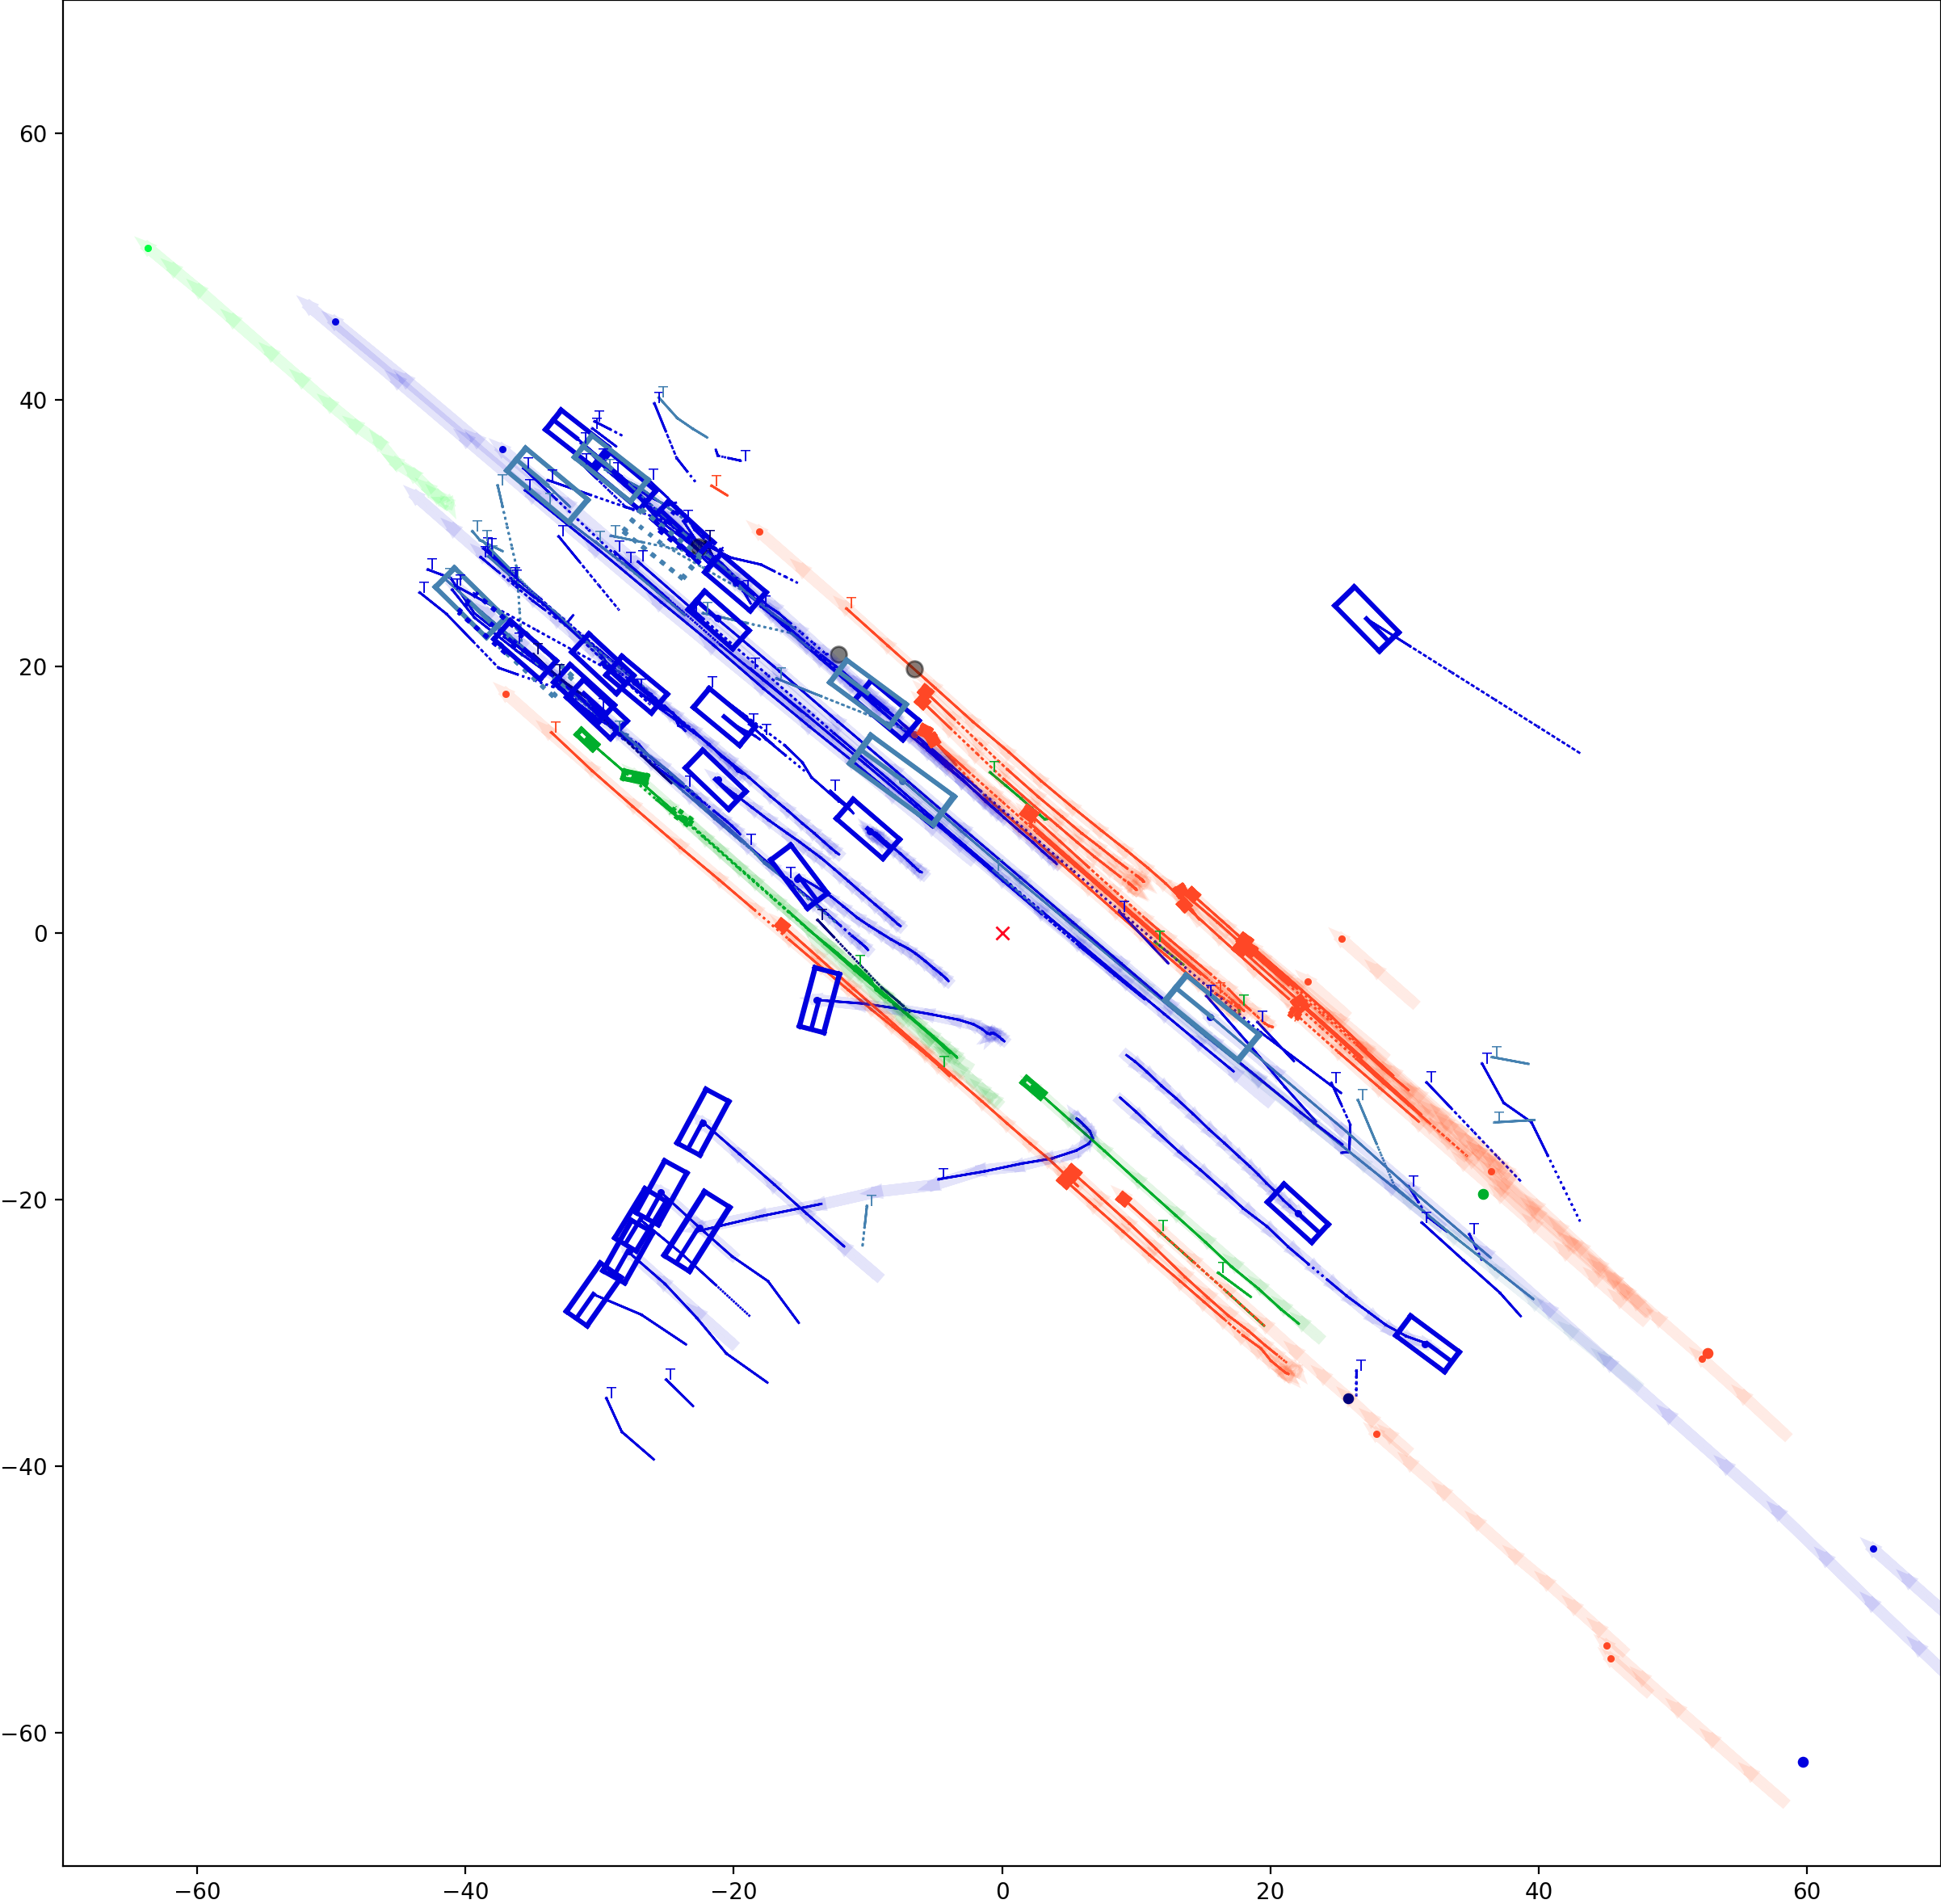
A car may be detected as a truck, or alternate between other categories. The repository’s class-specific runner makes these errors relevant to association and track continuity.
Direction in the analysis: use classification information over time. The nuScenes output still requires a consistent class label within a track.
An original example labeled “Alternating Classification” in the analysis.
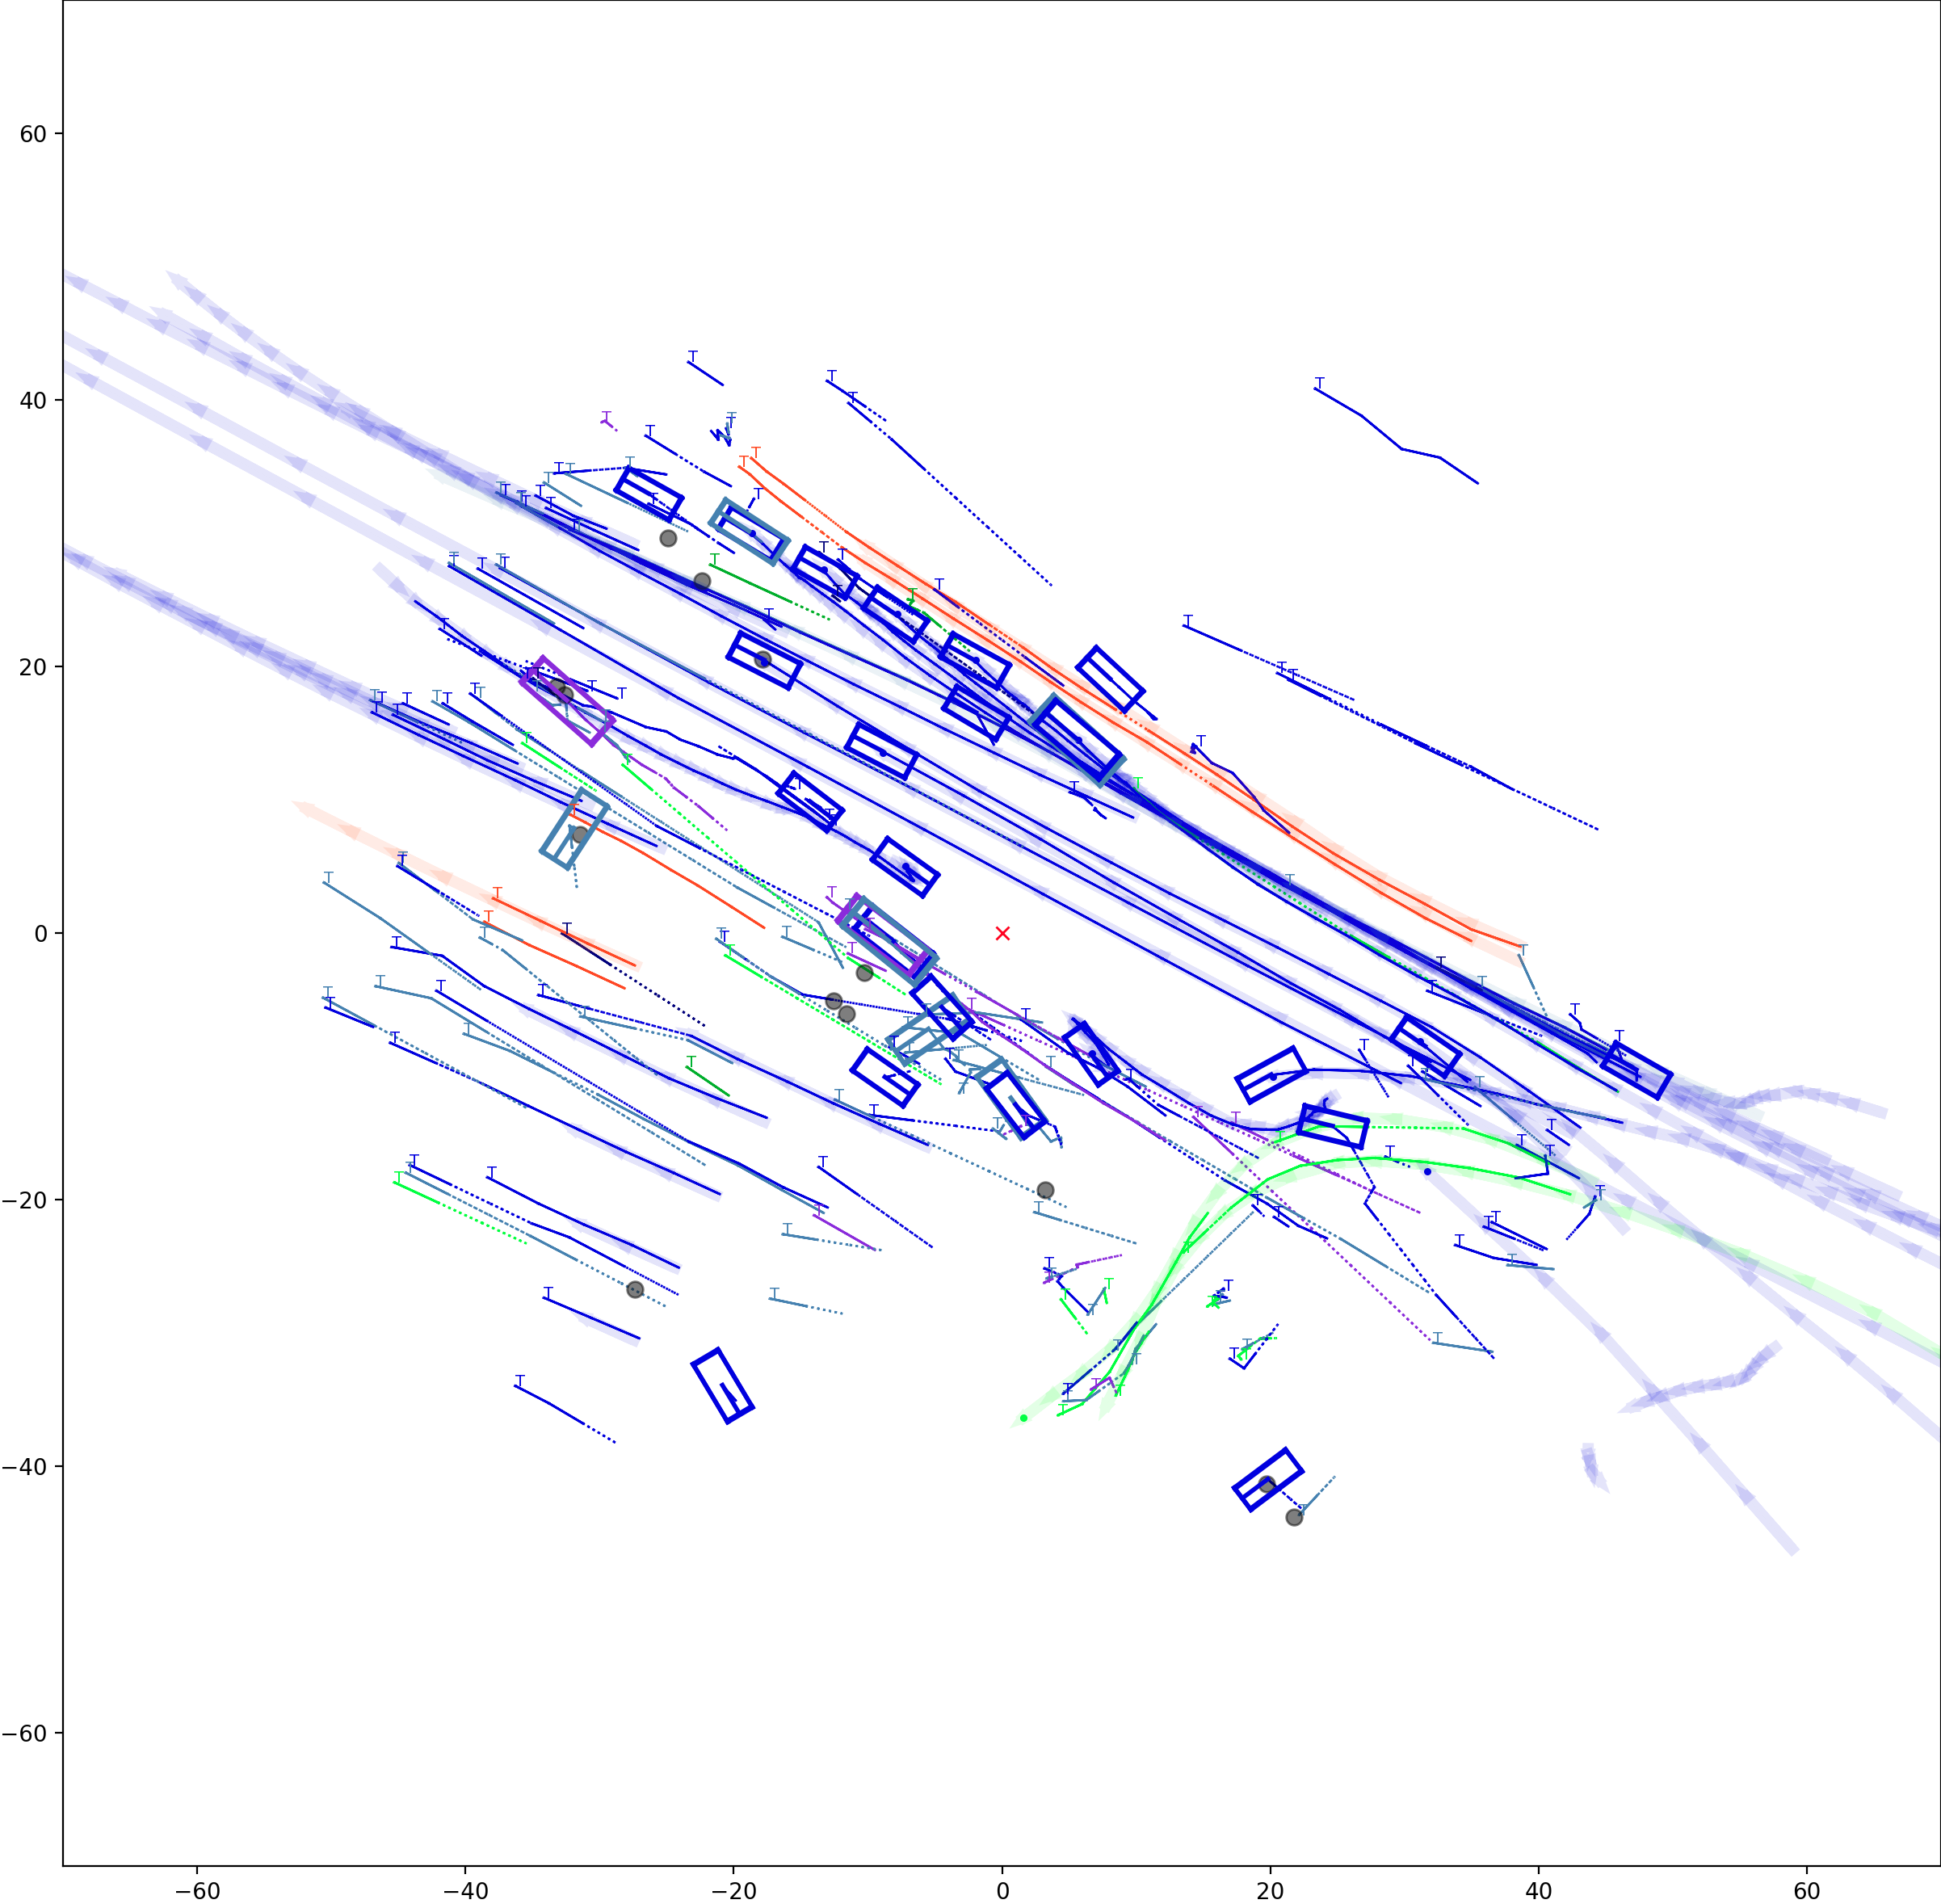
05 · Ambiguous association
Crossings put identities under pressure.
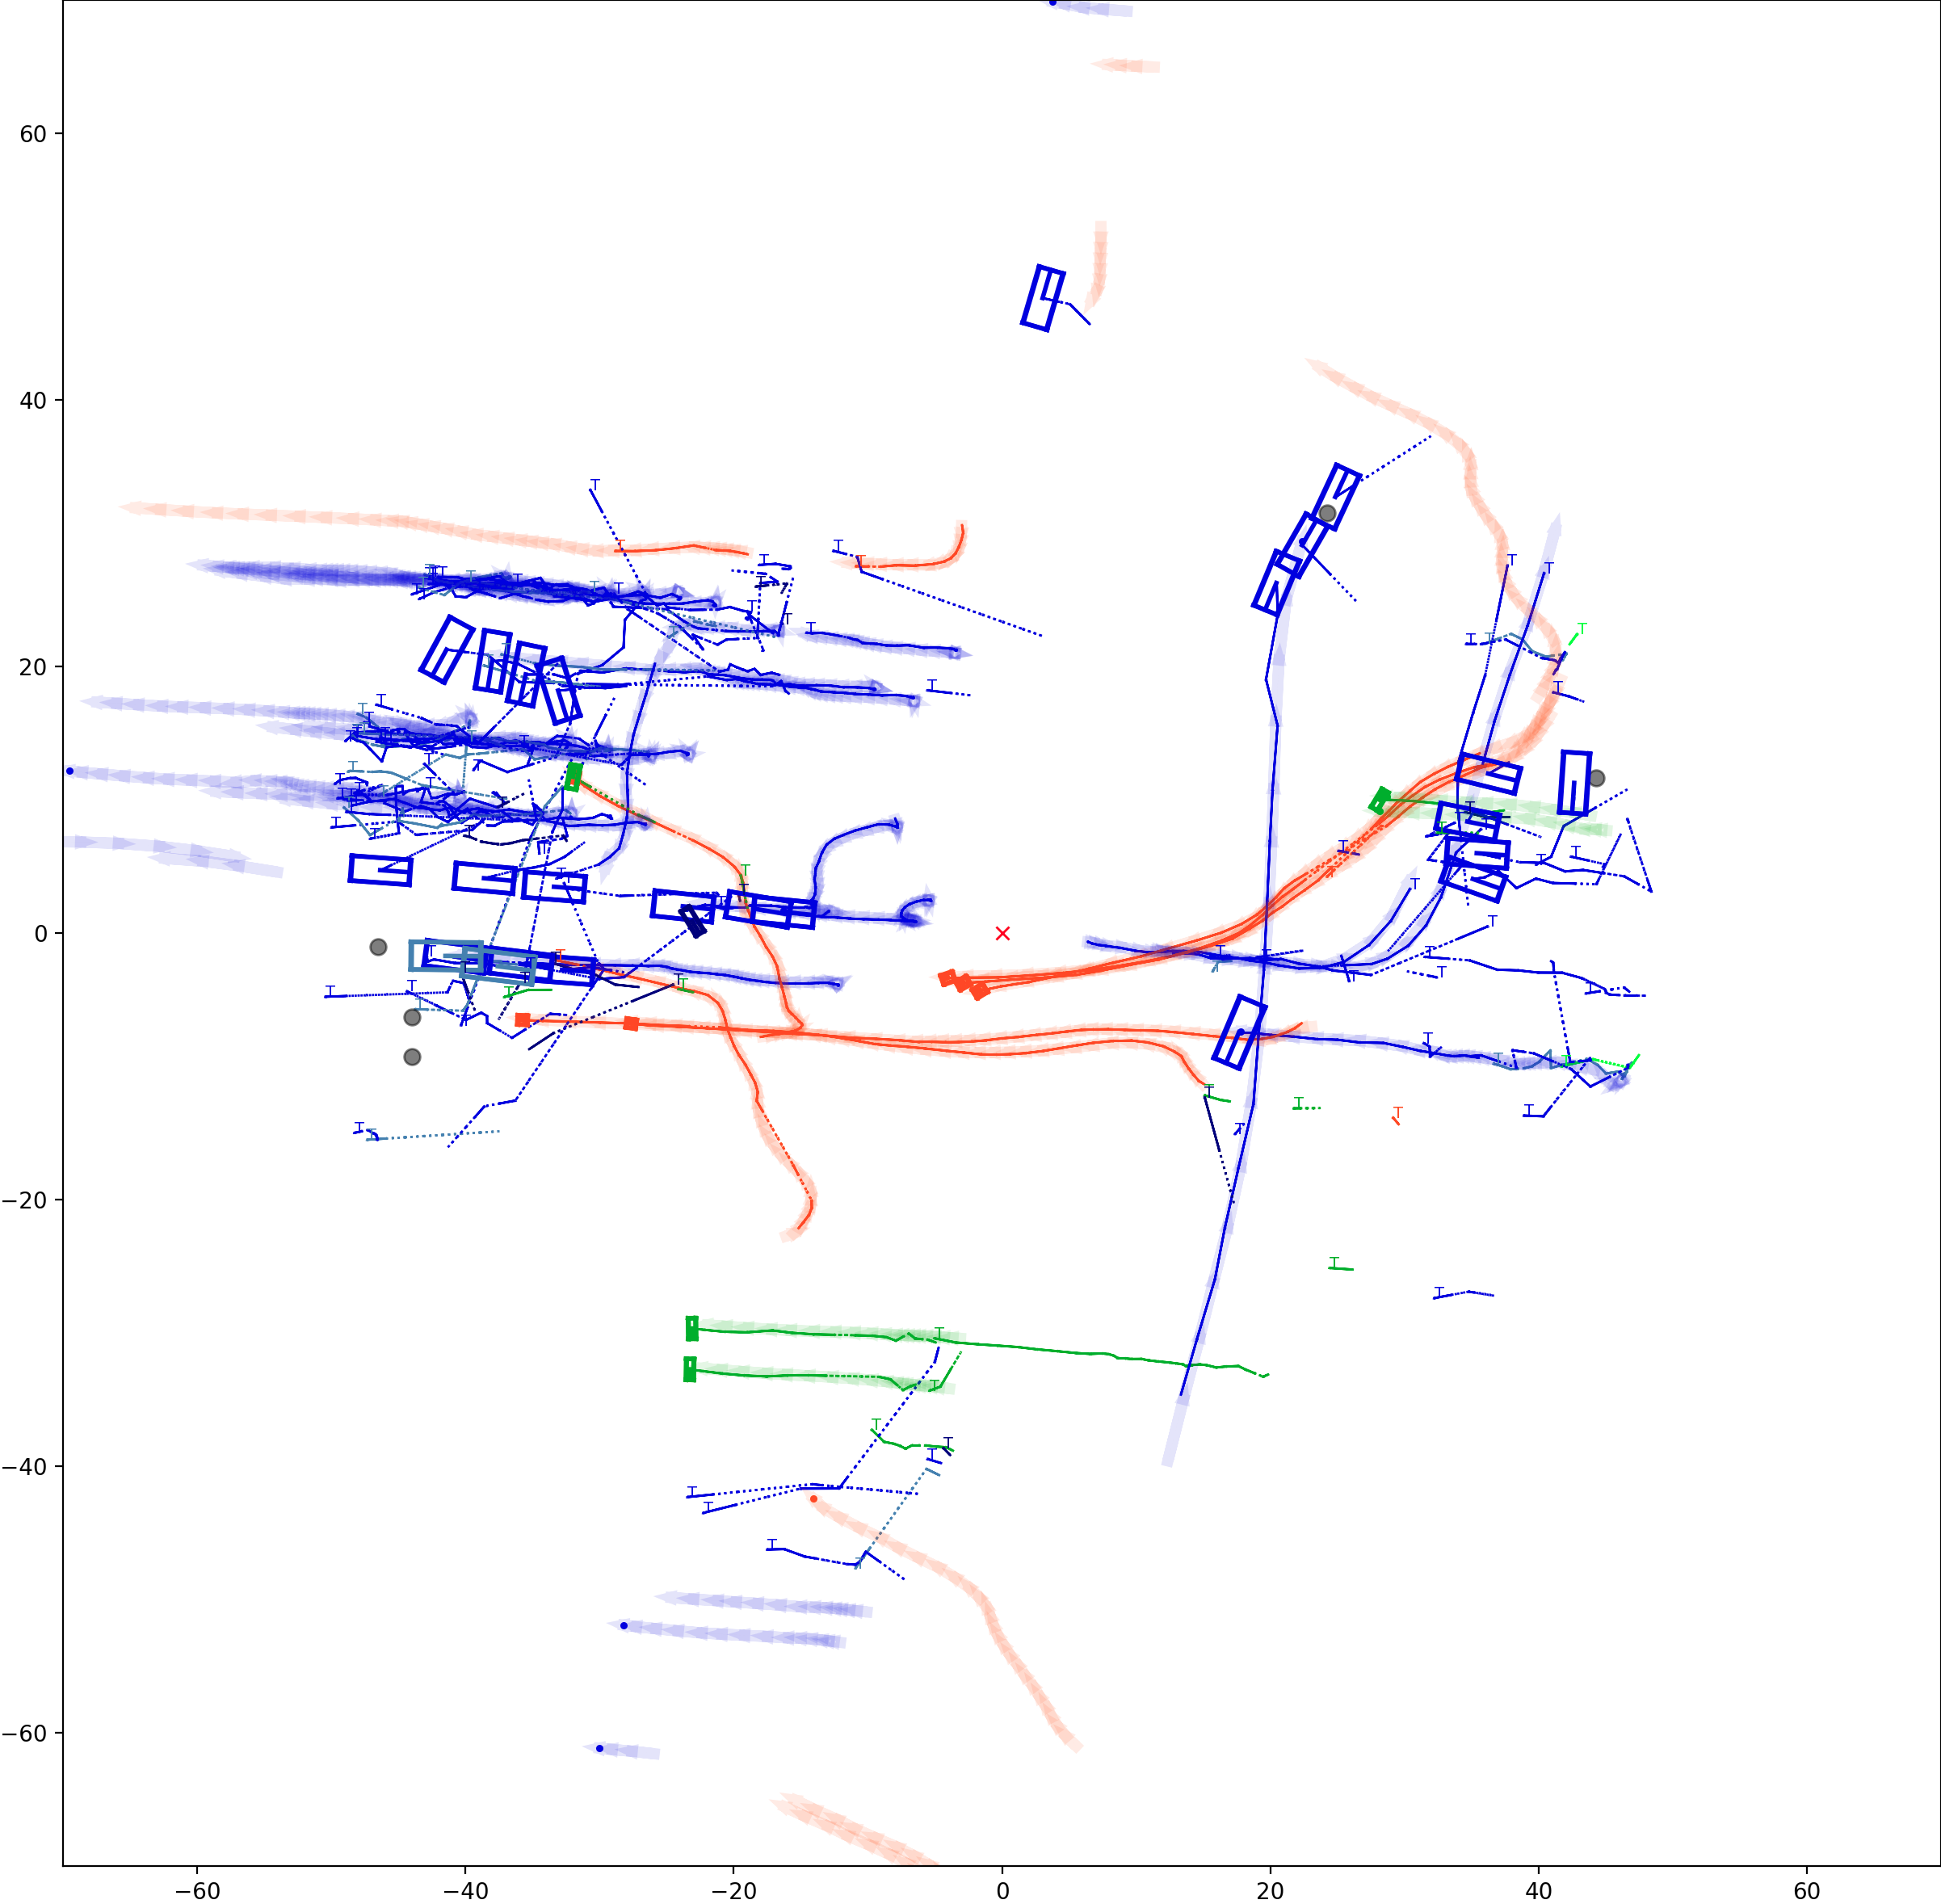
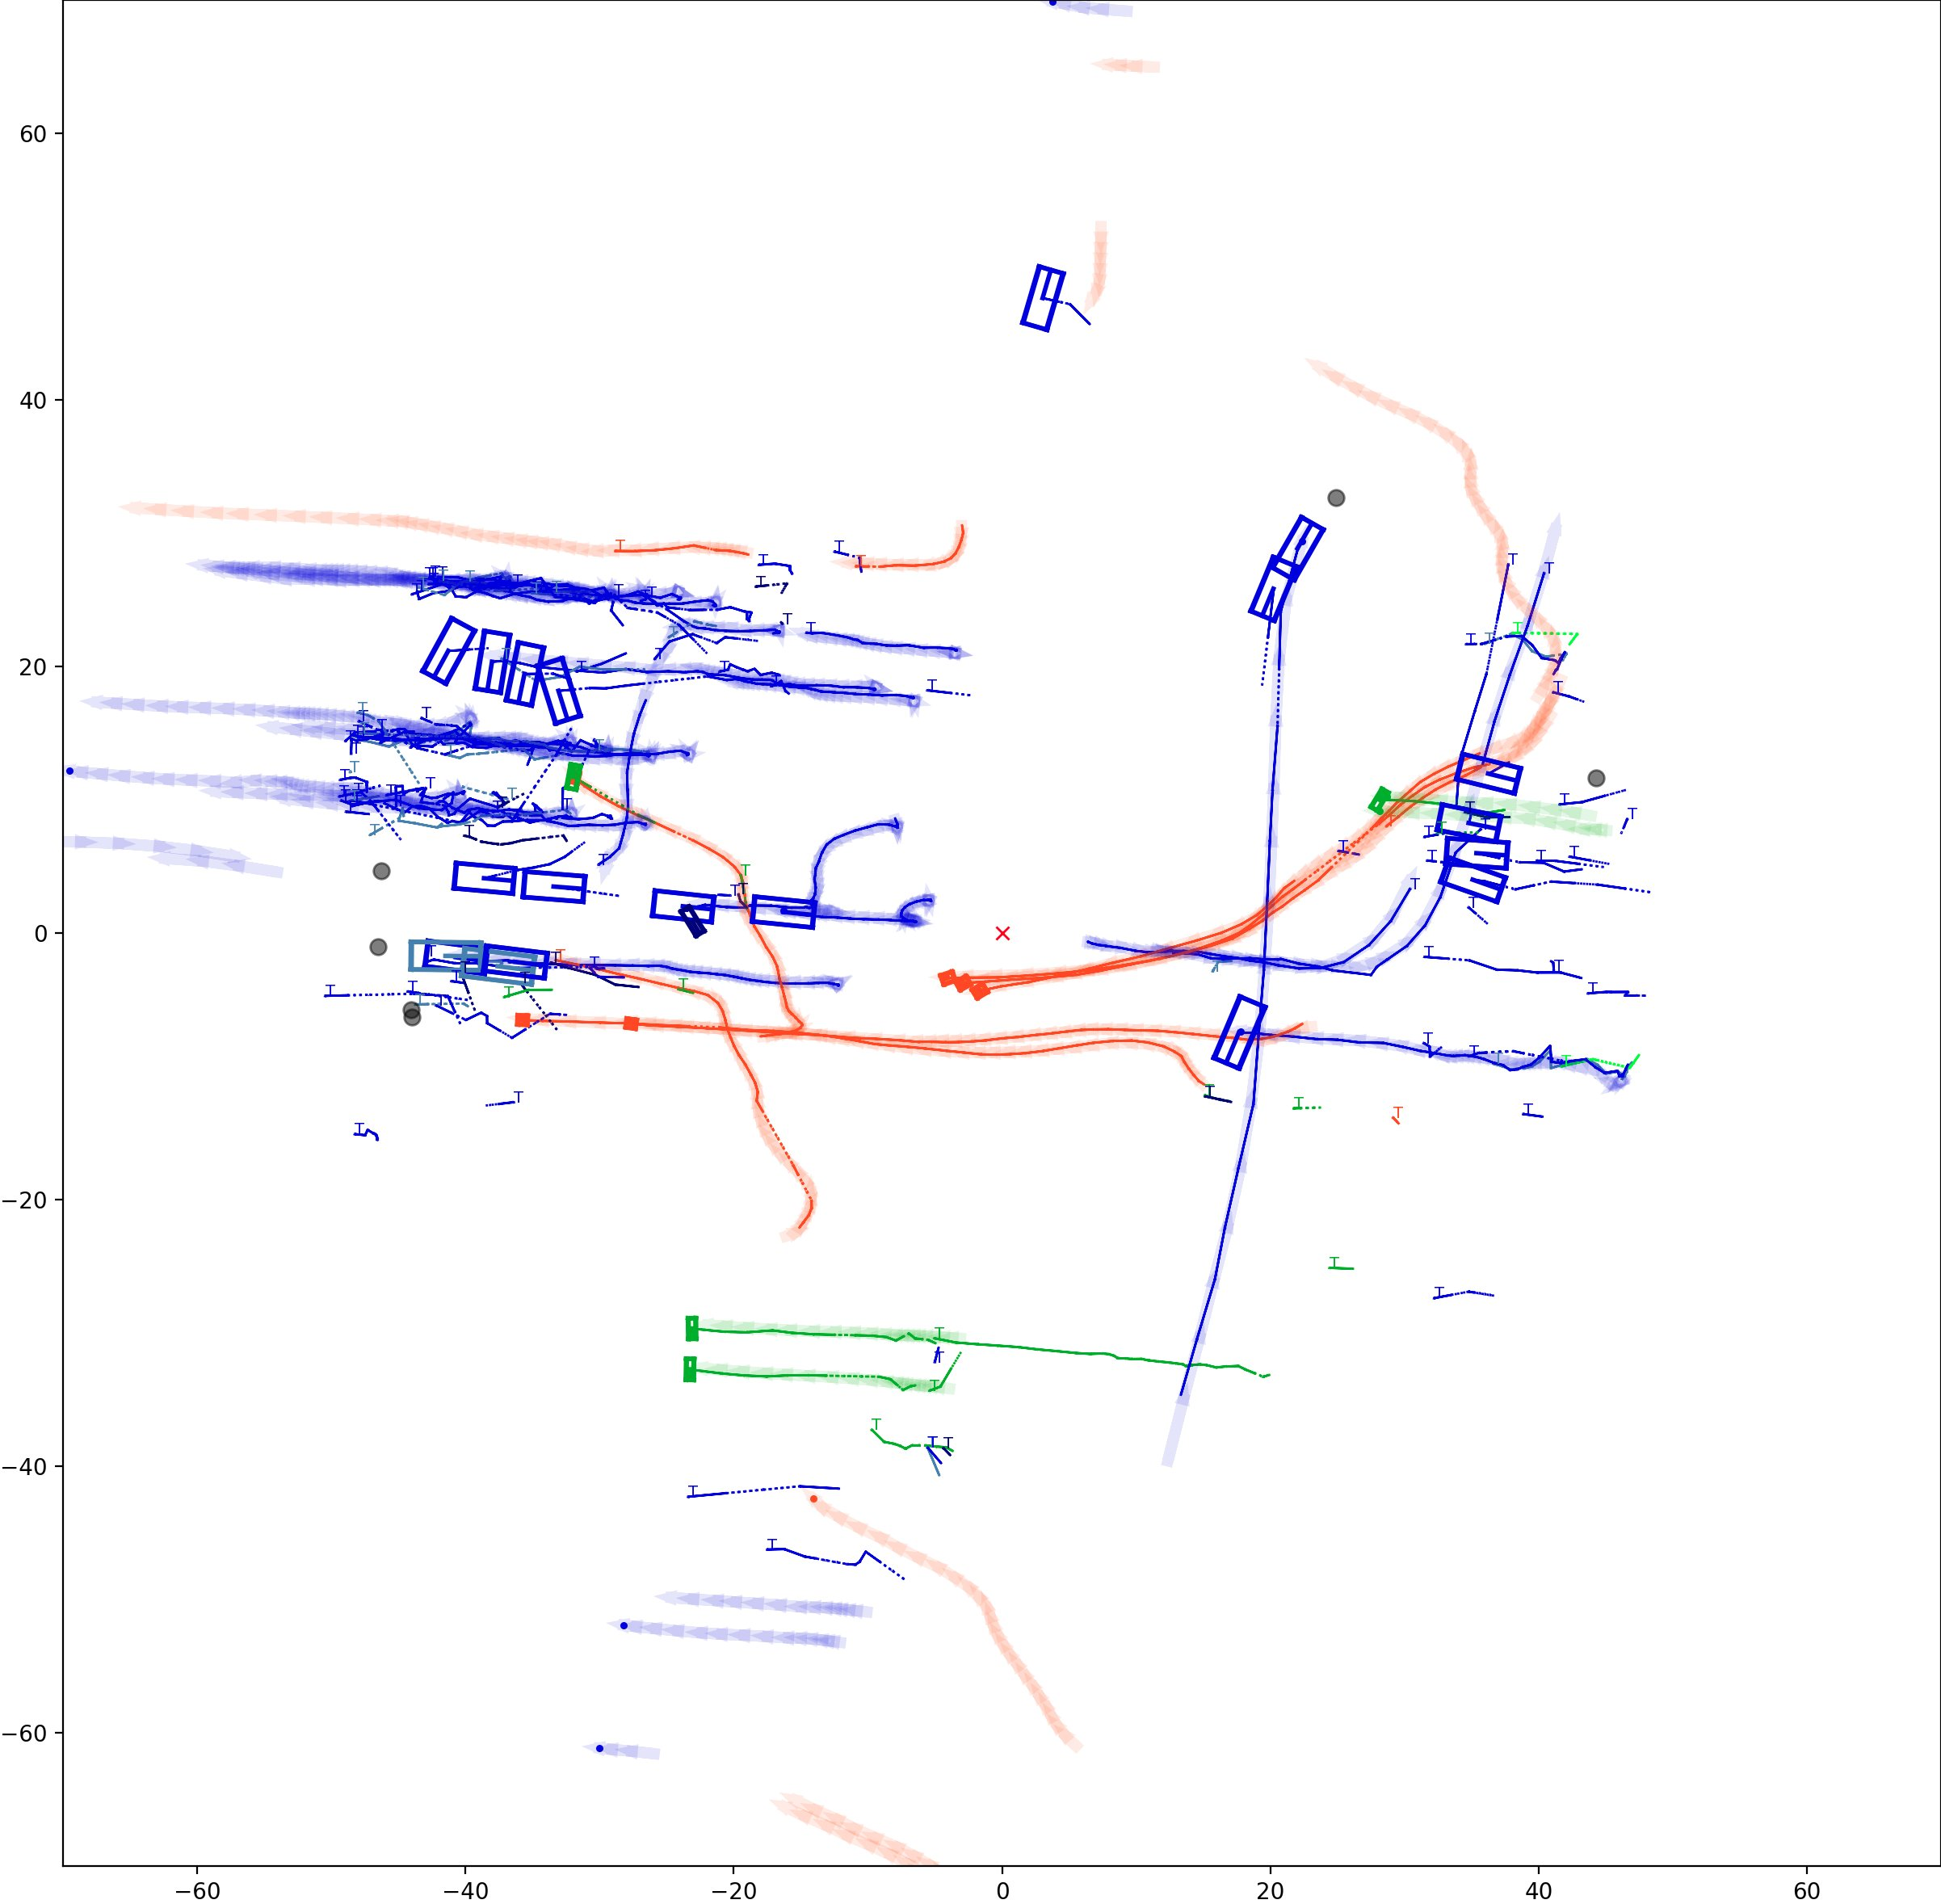
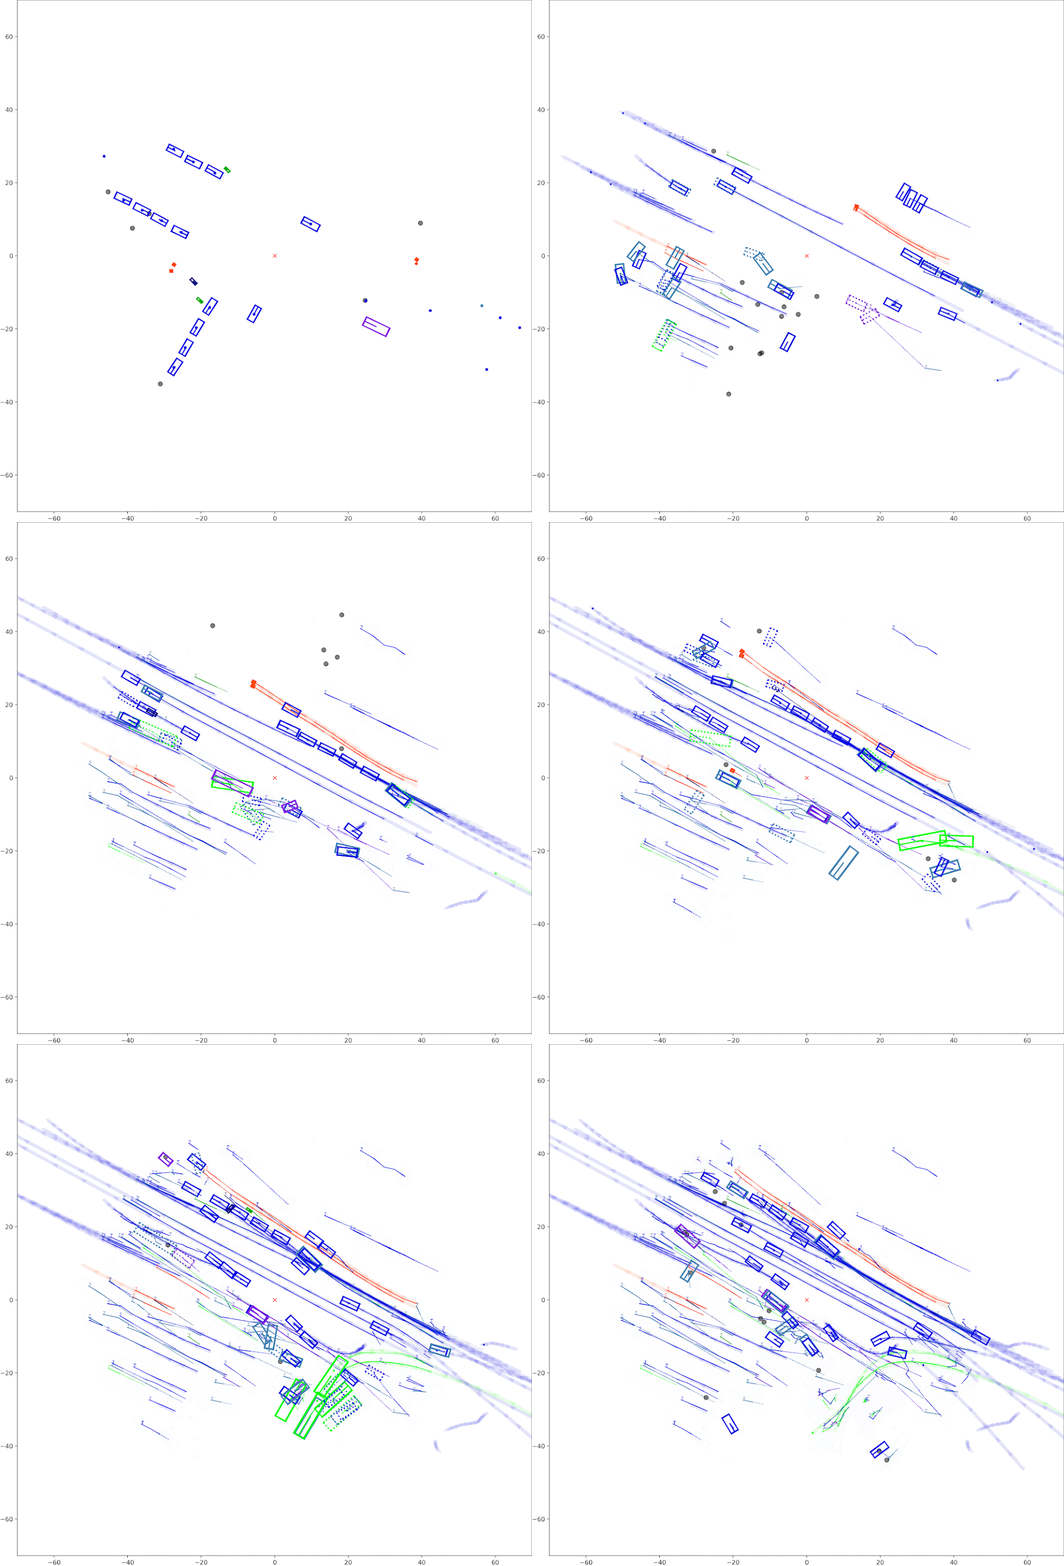
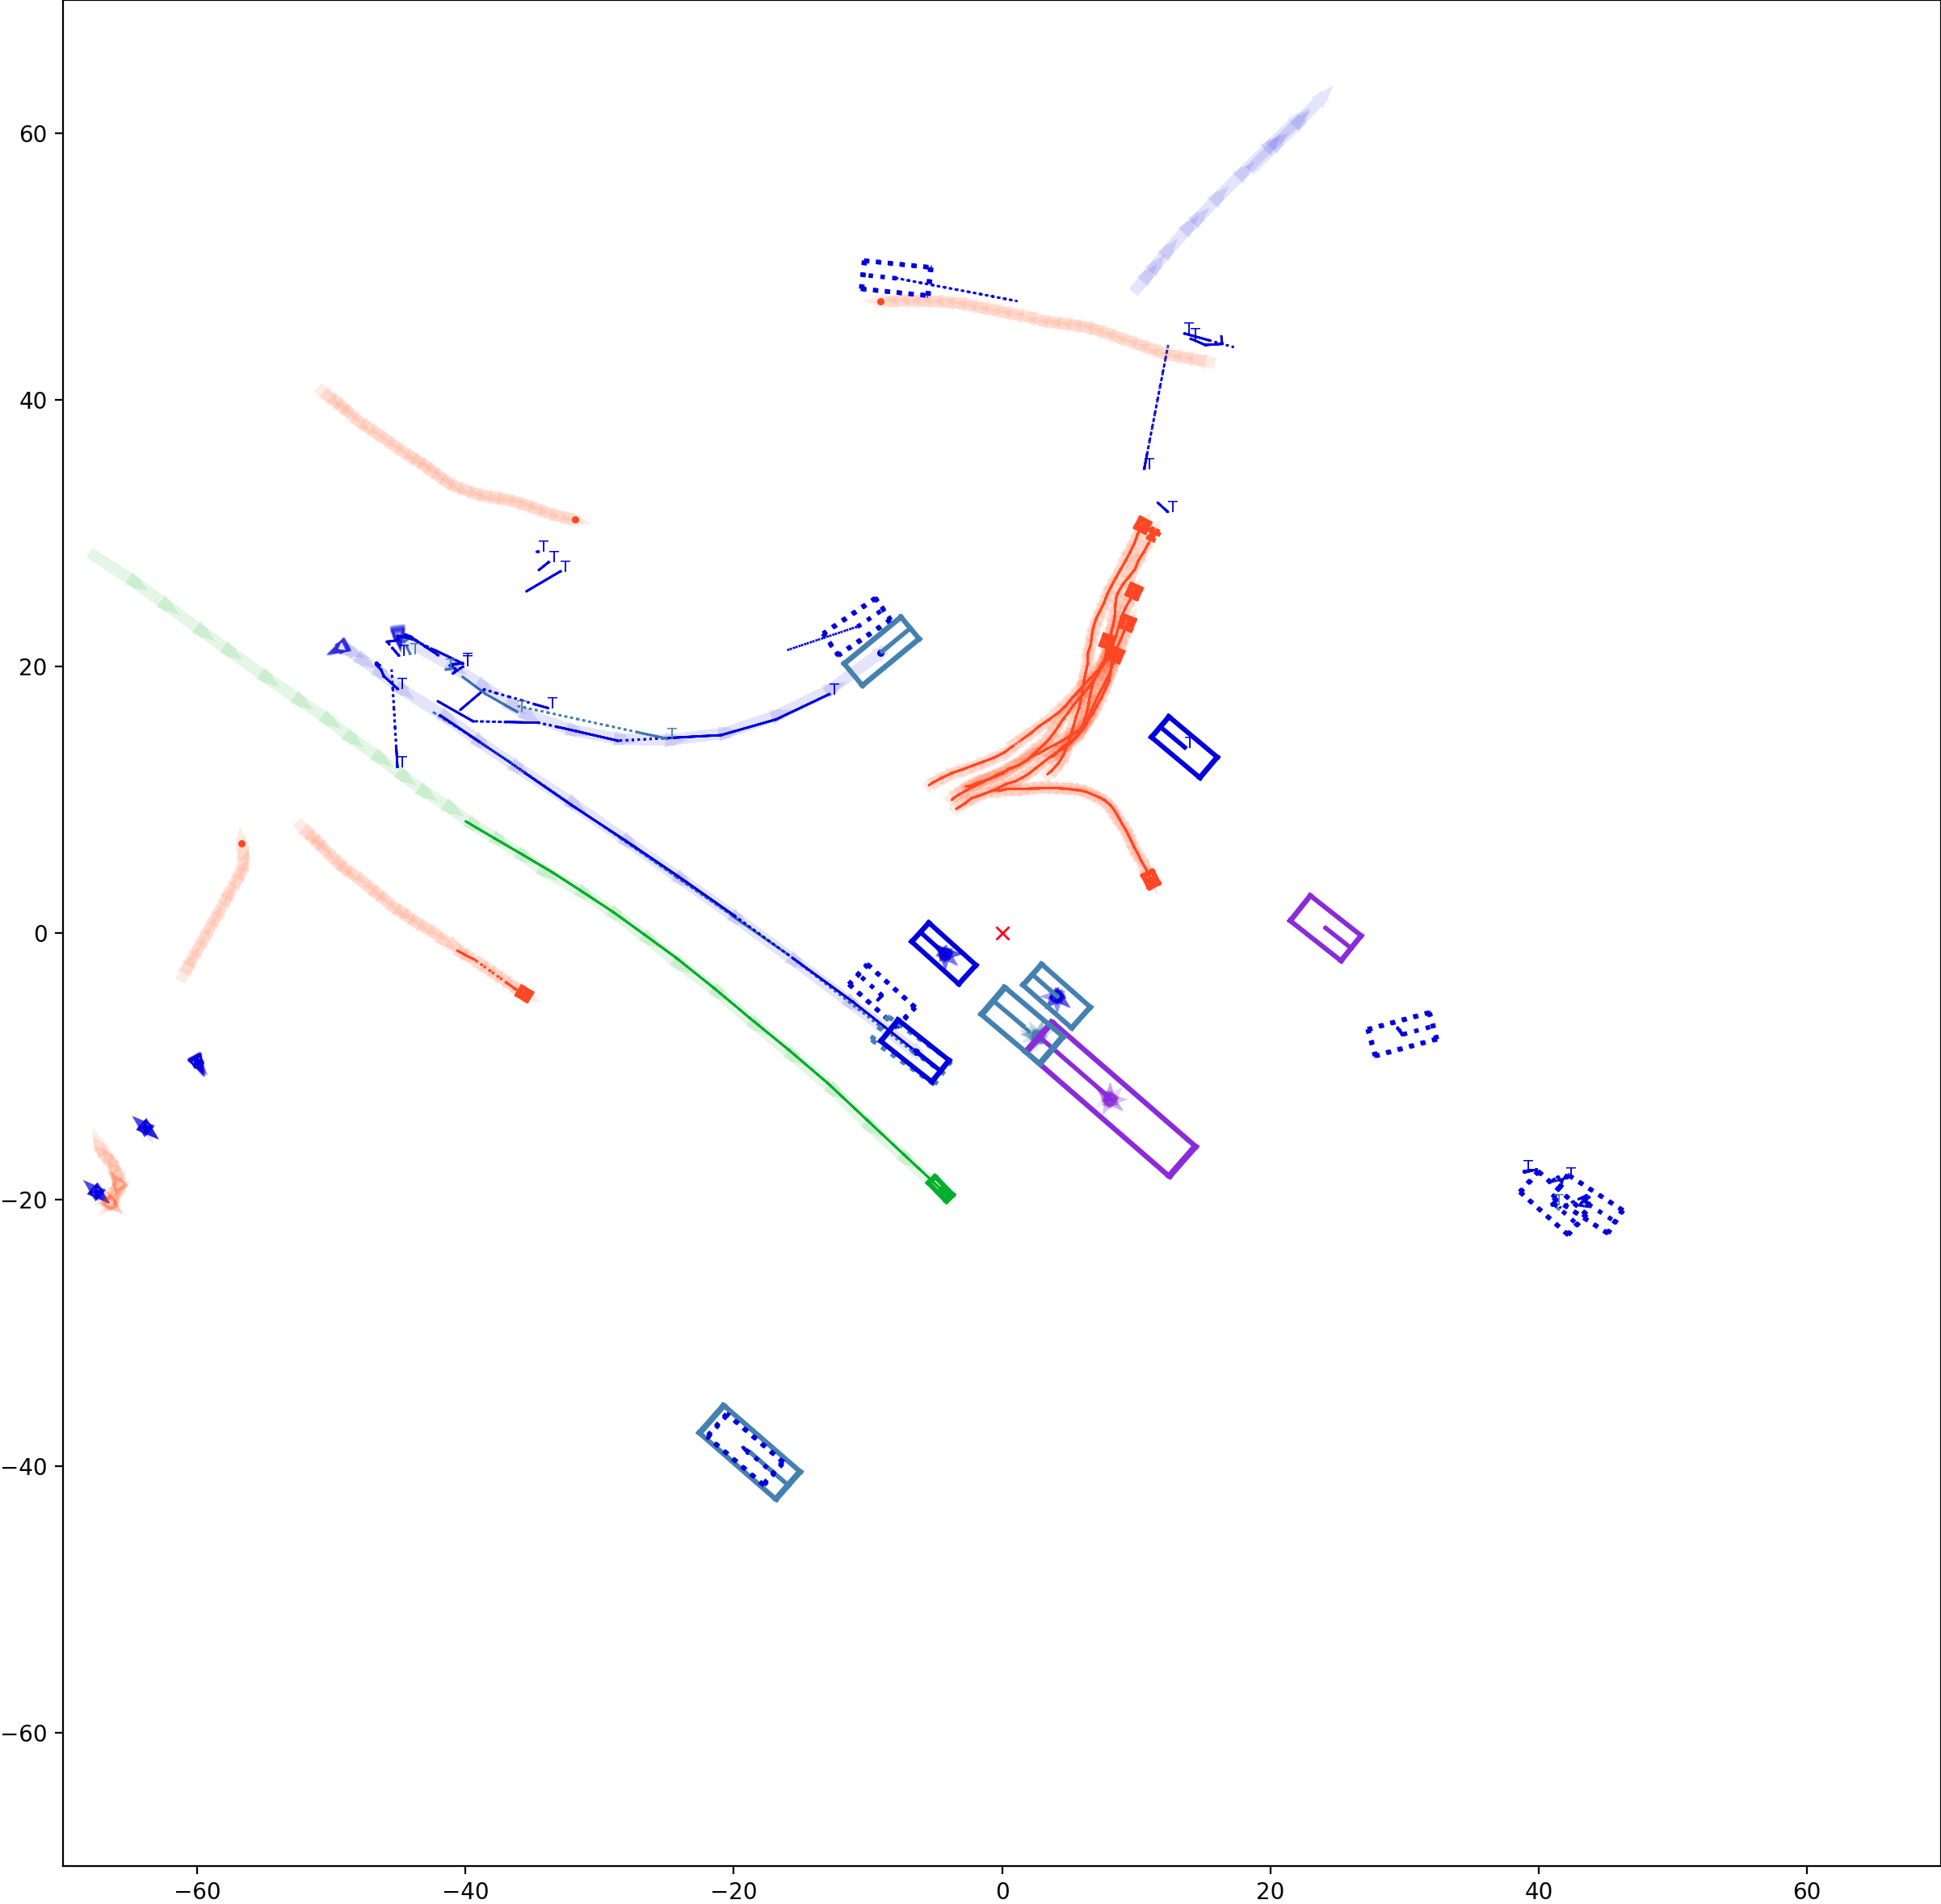
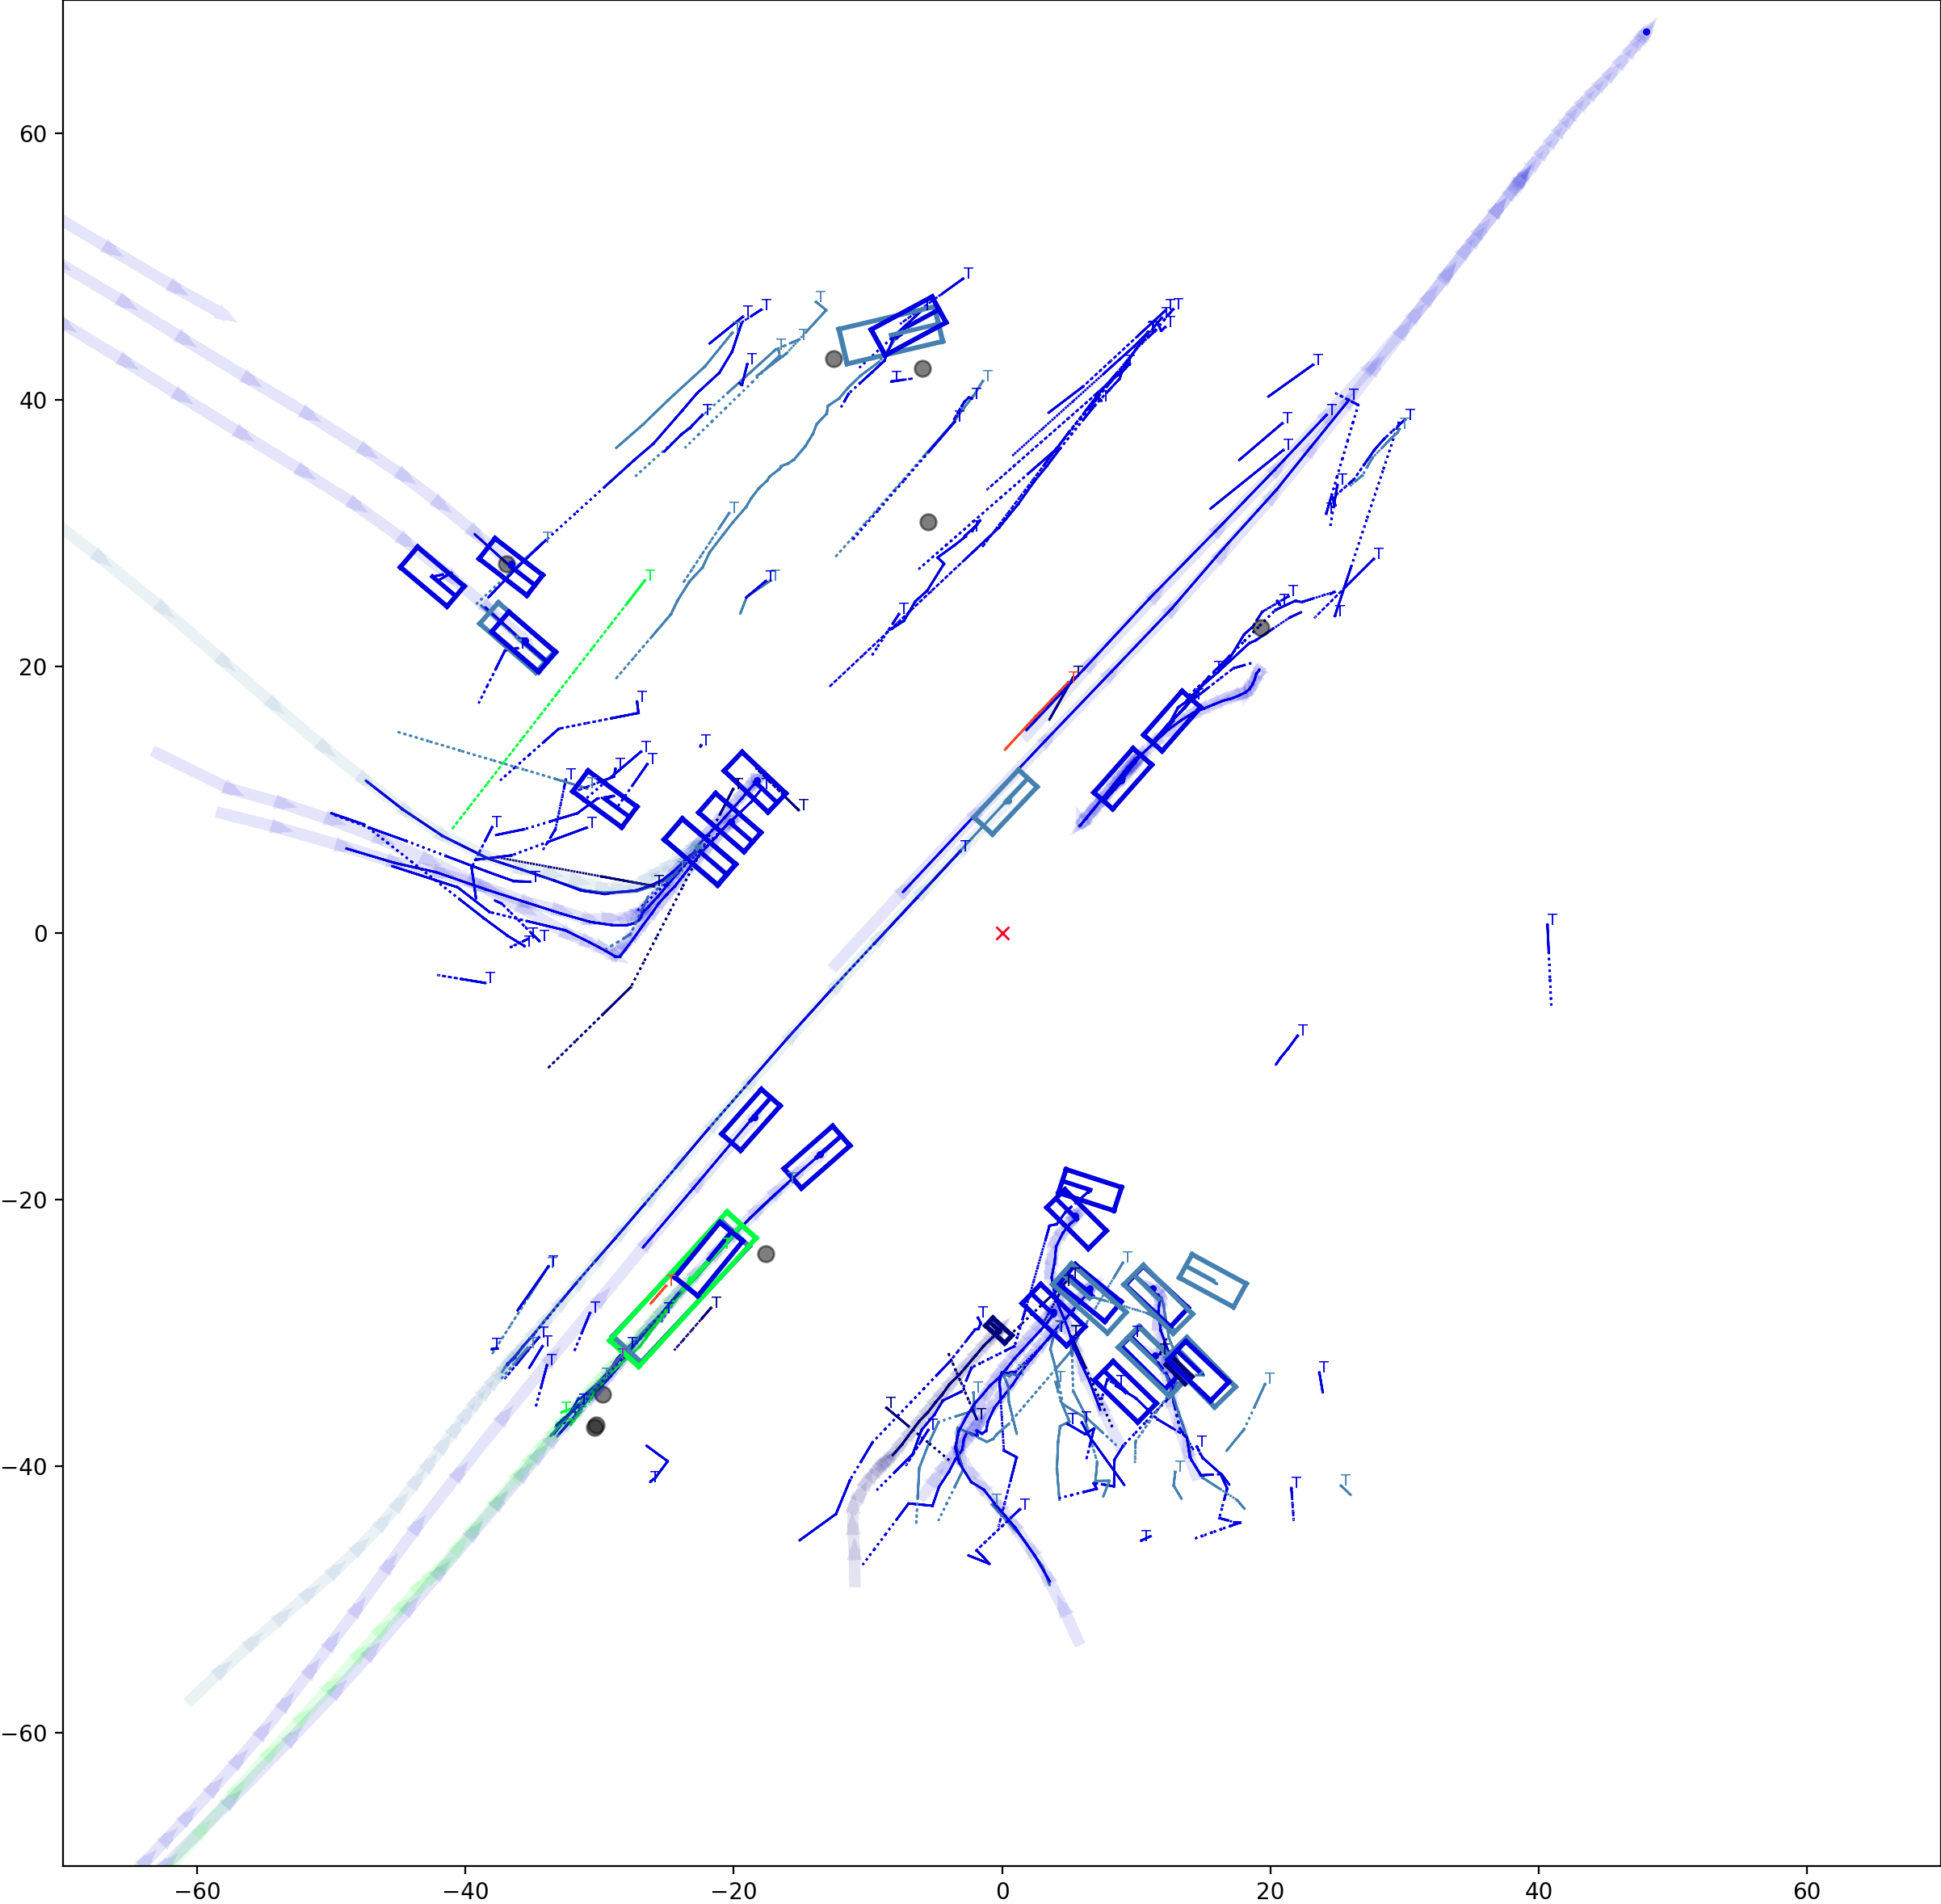
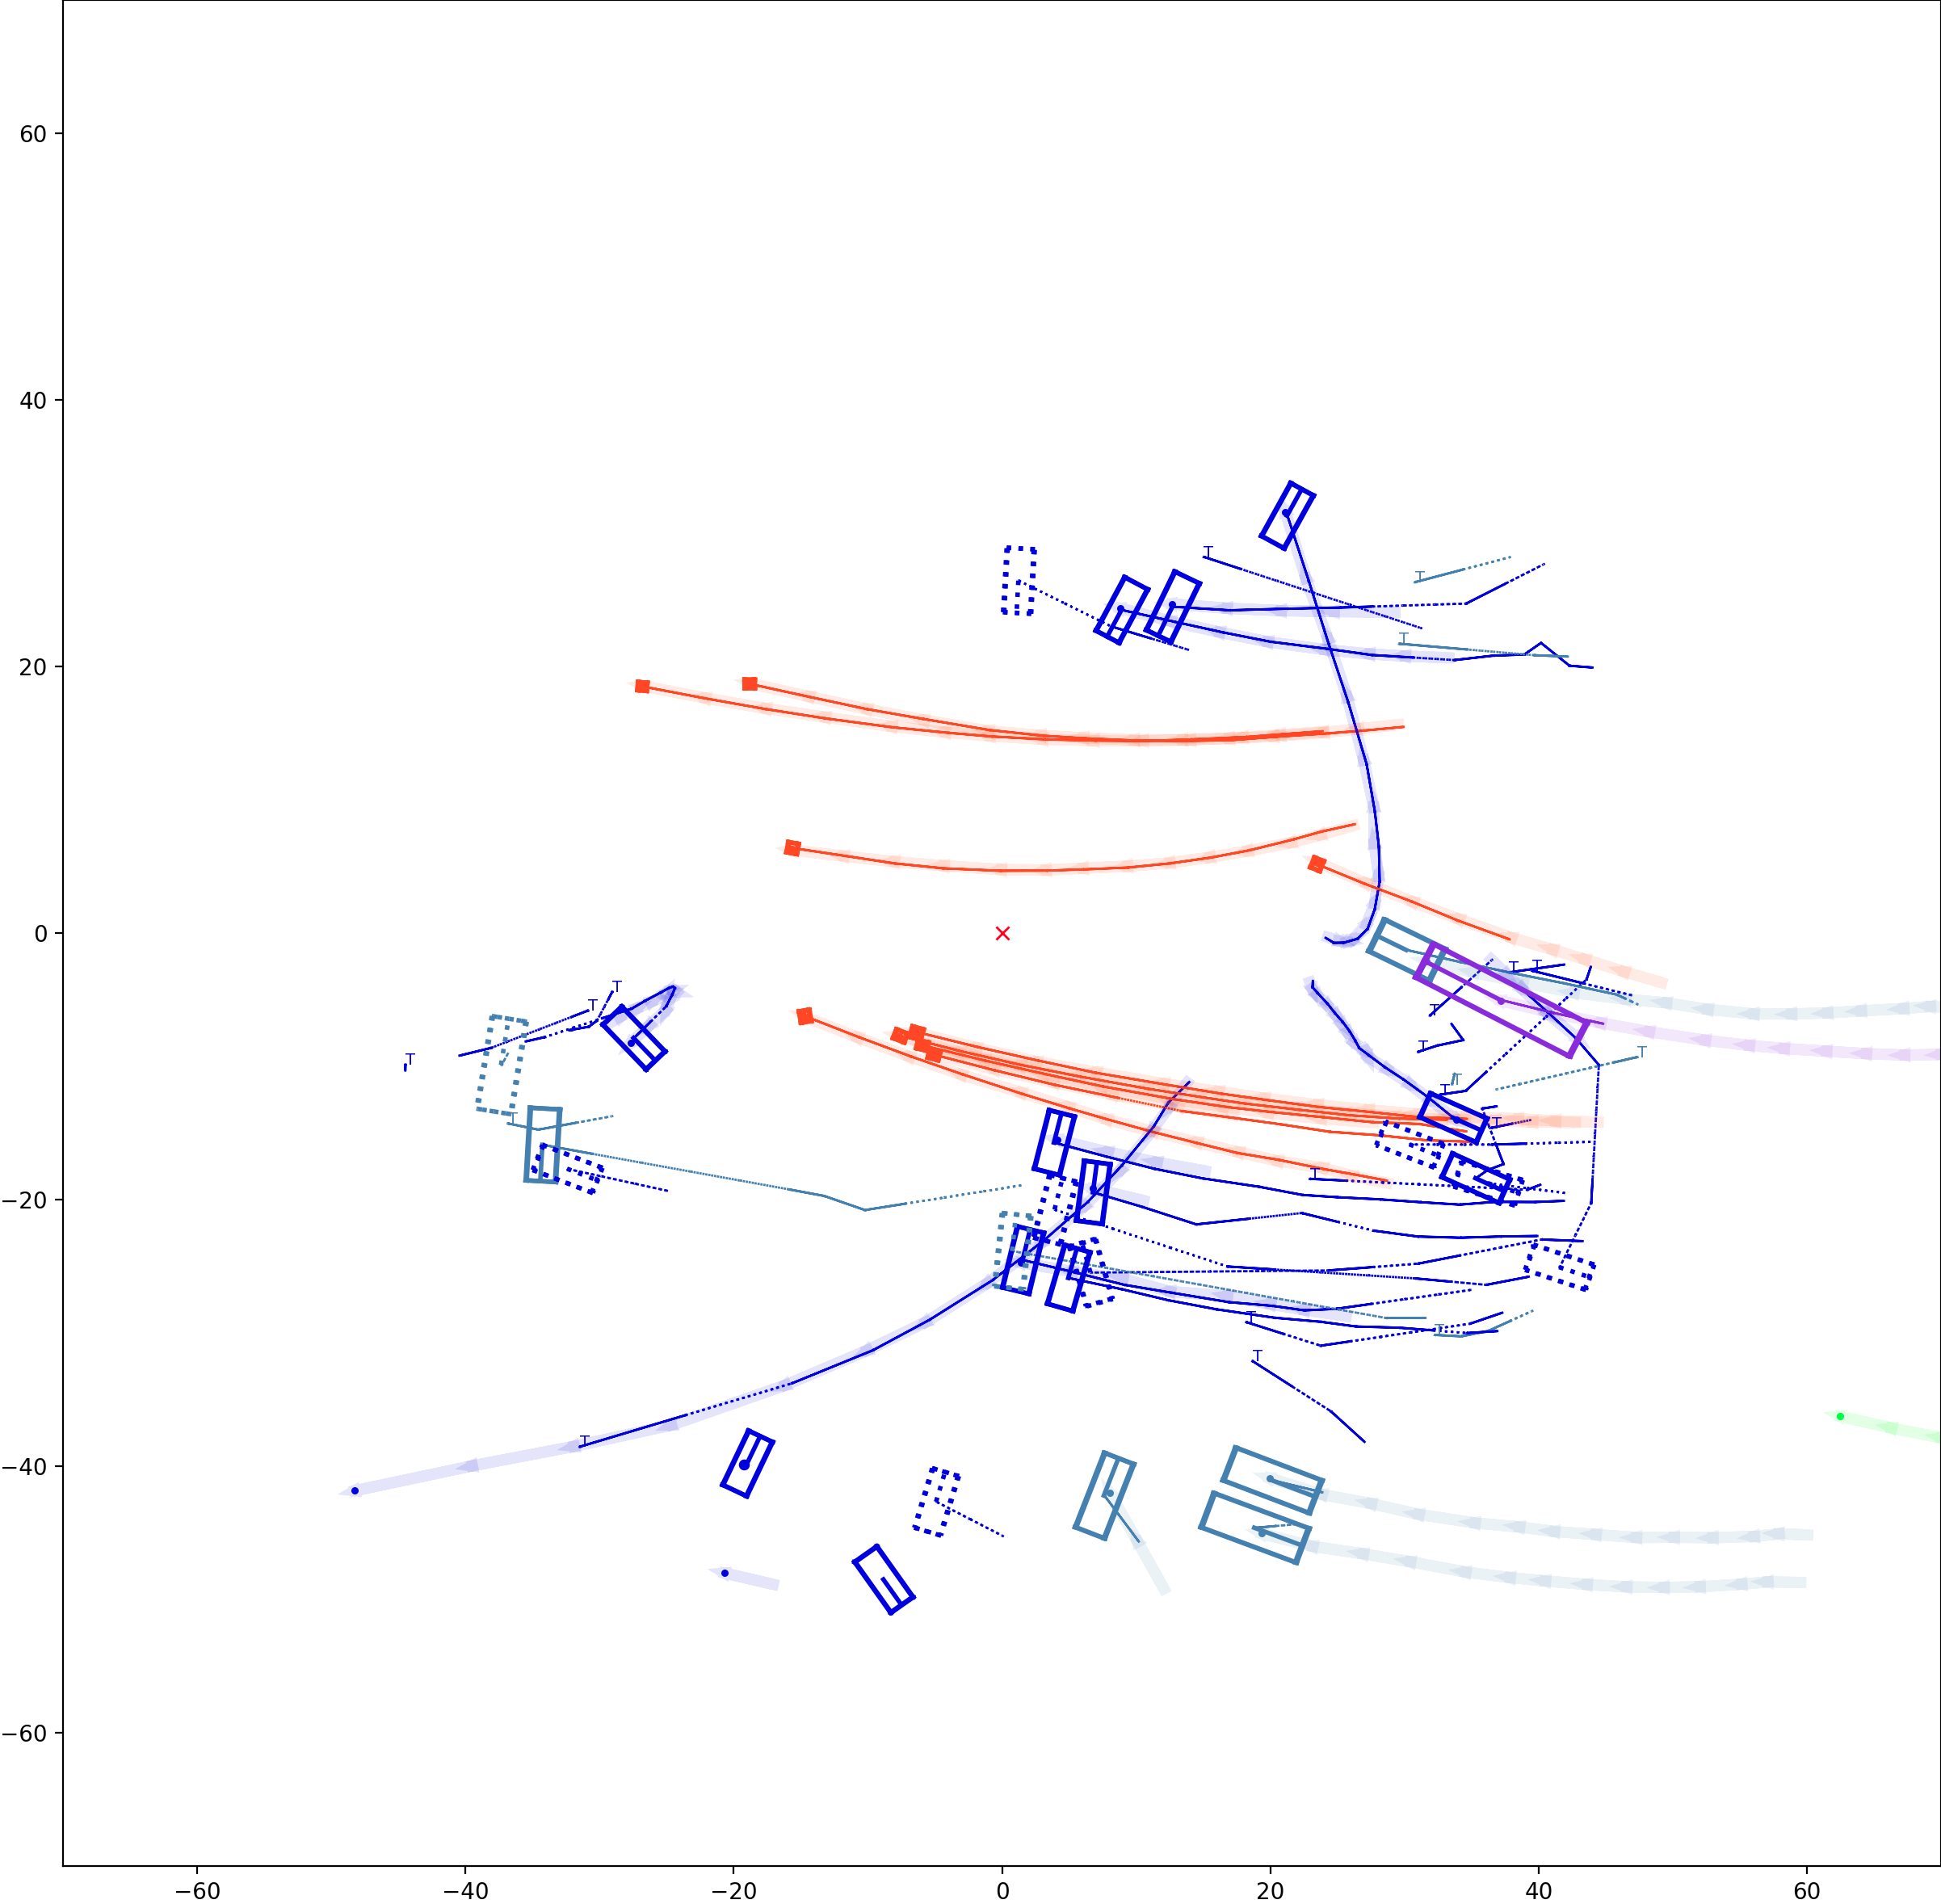
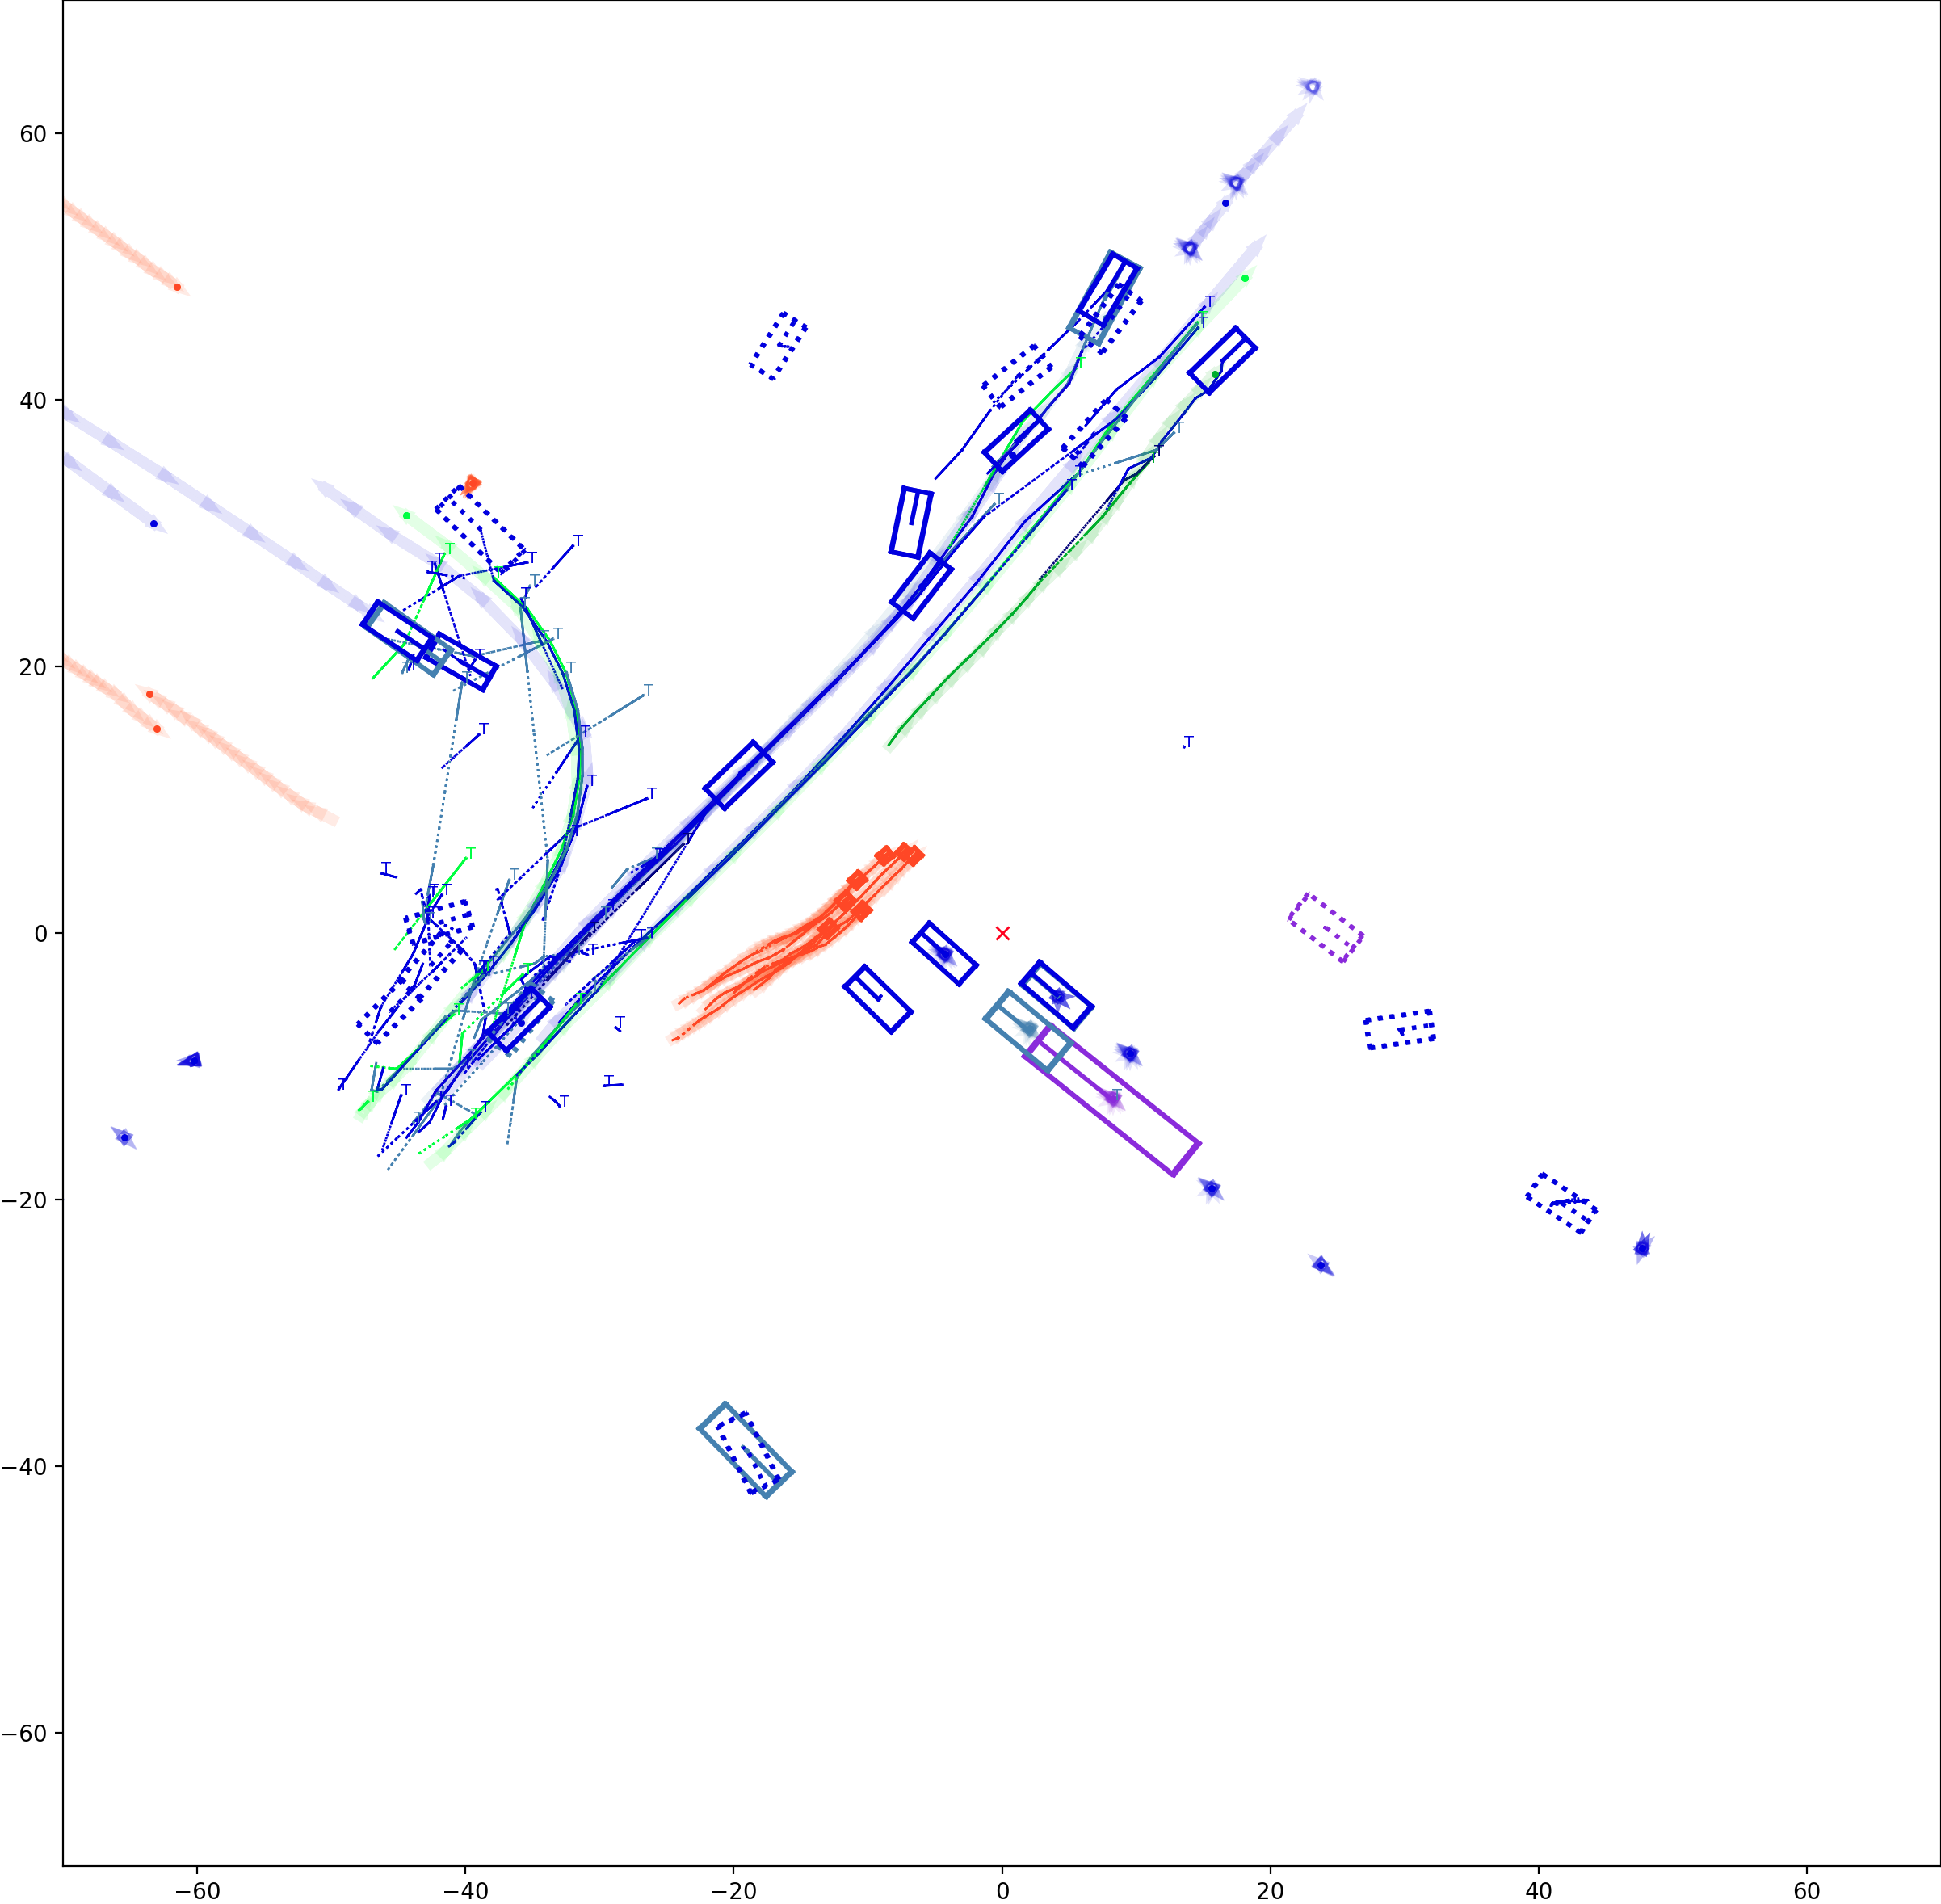
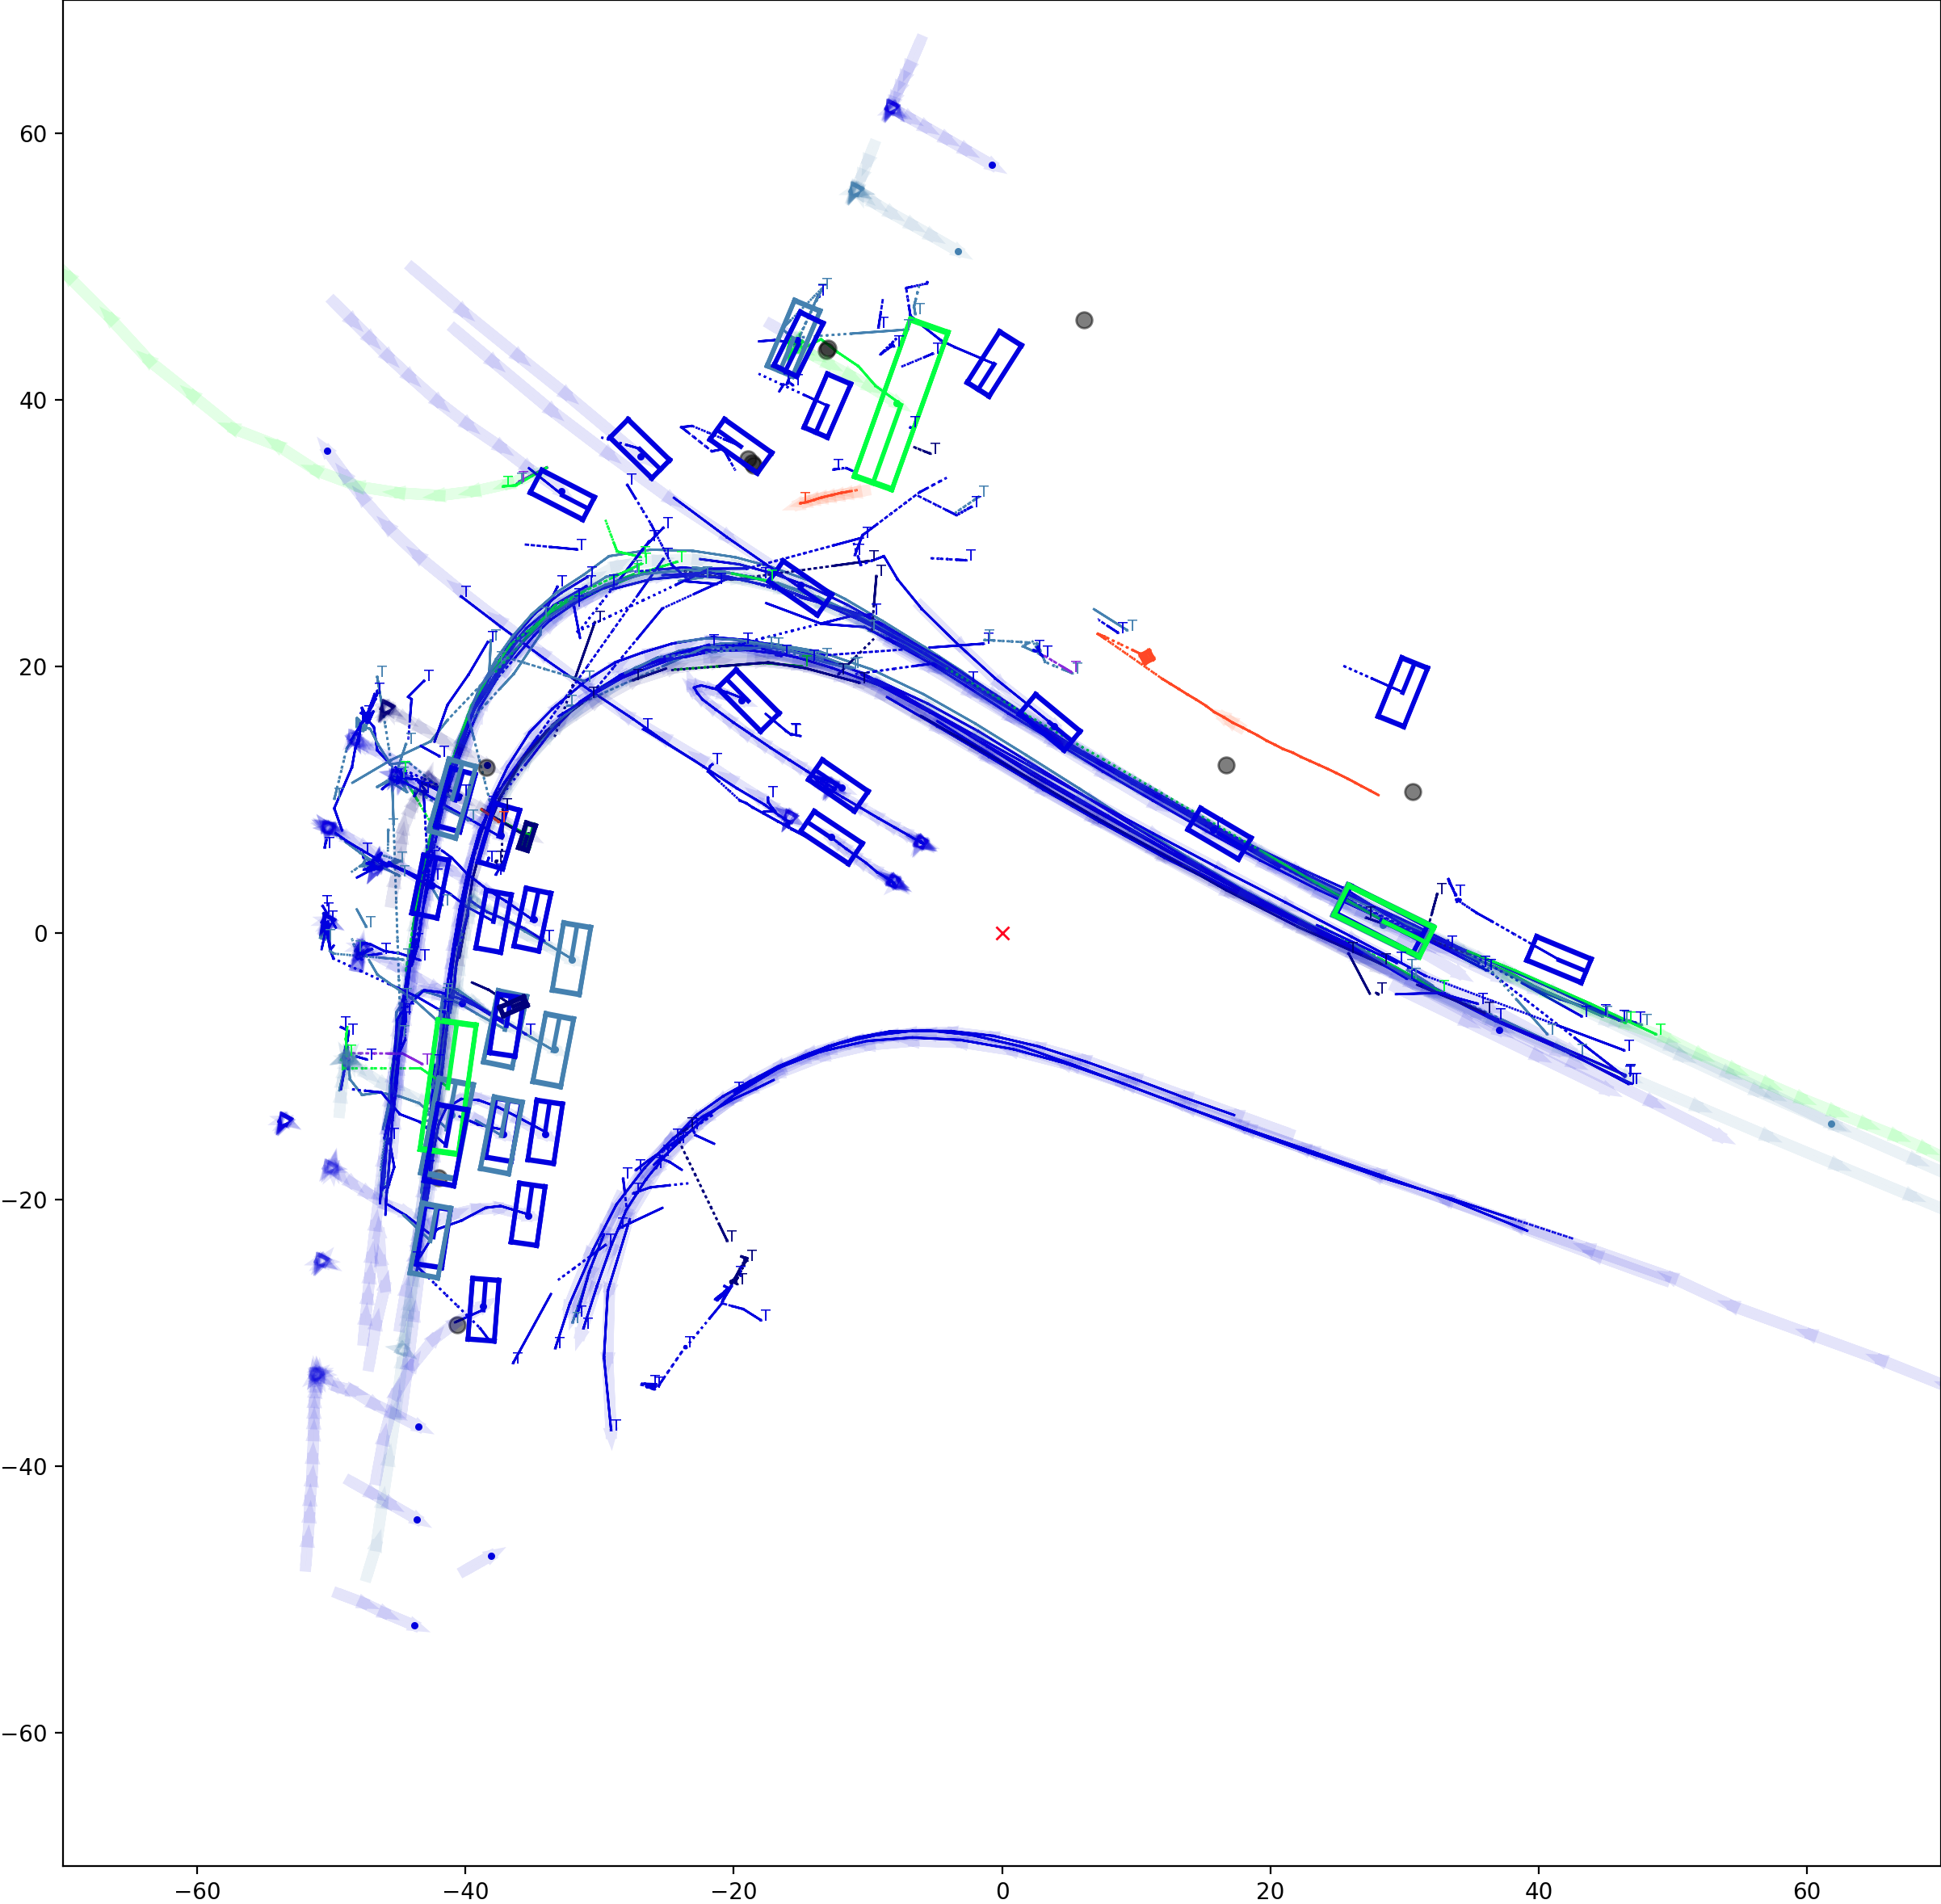
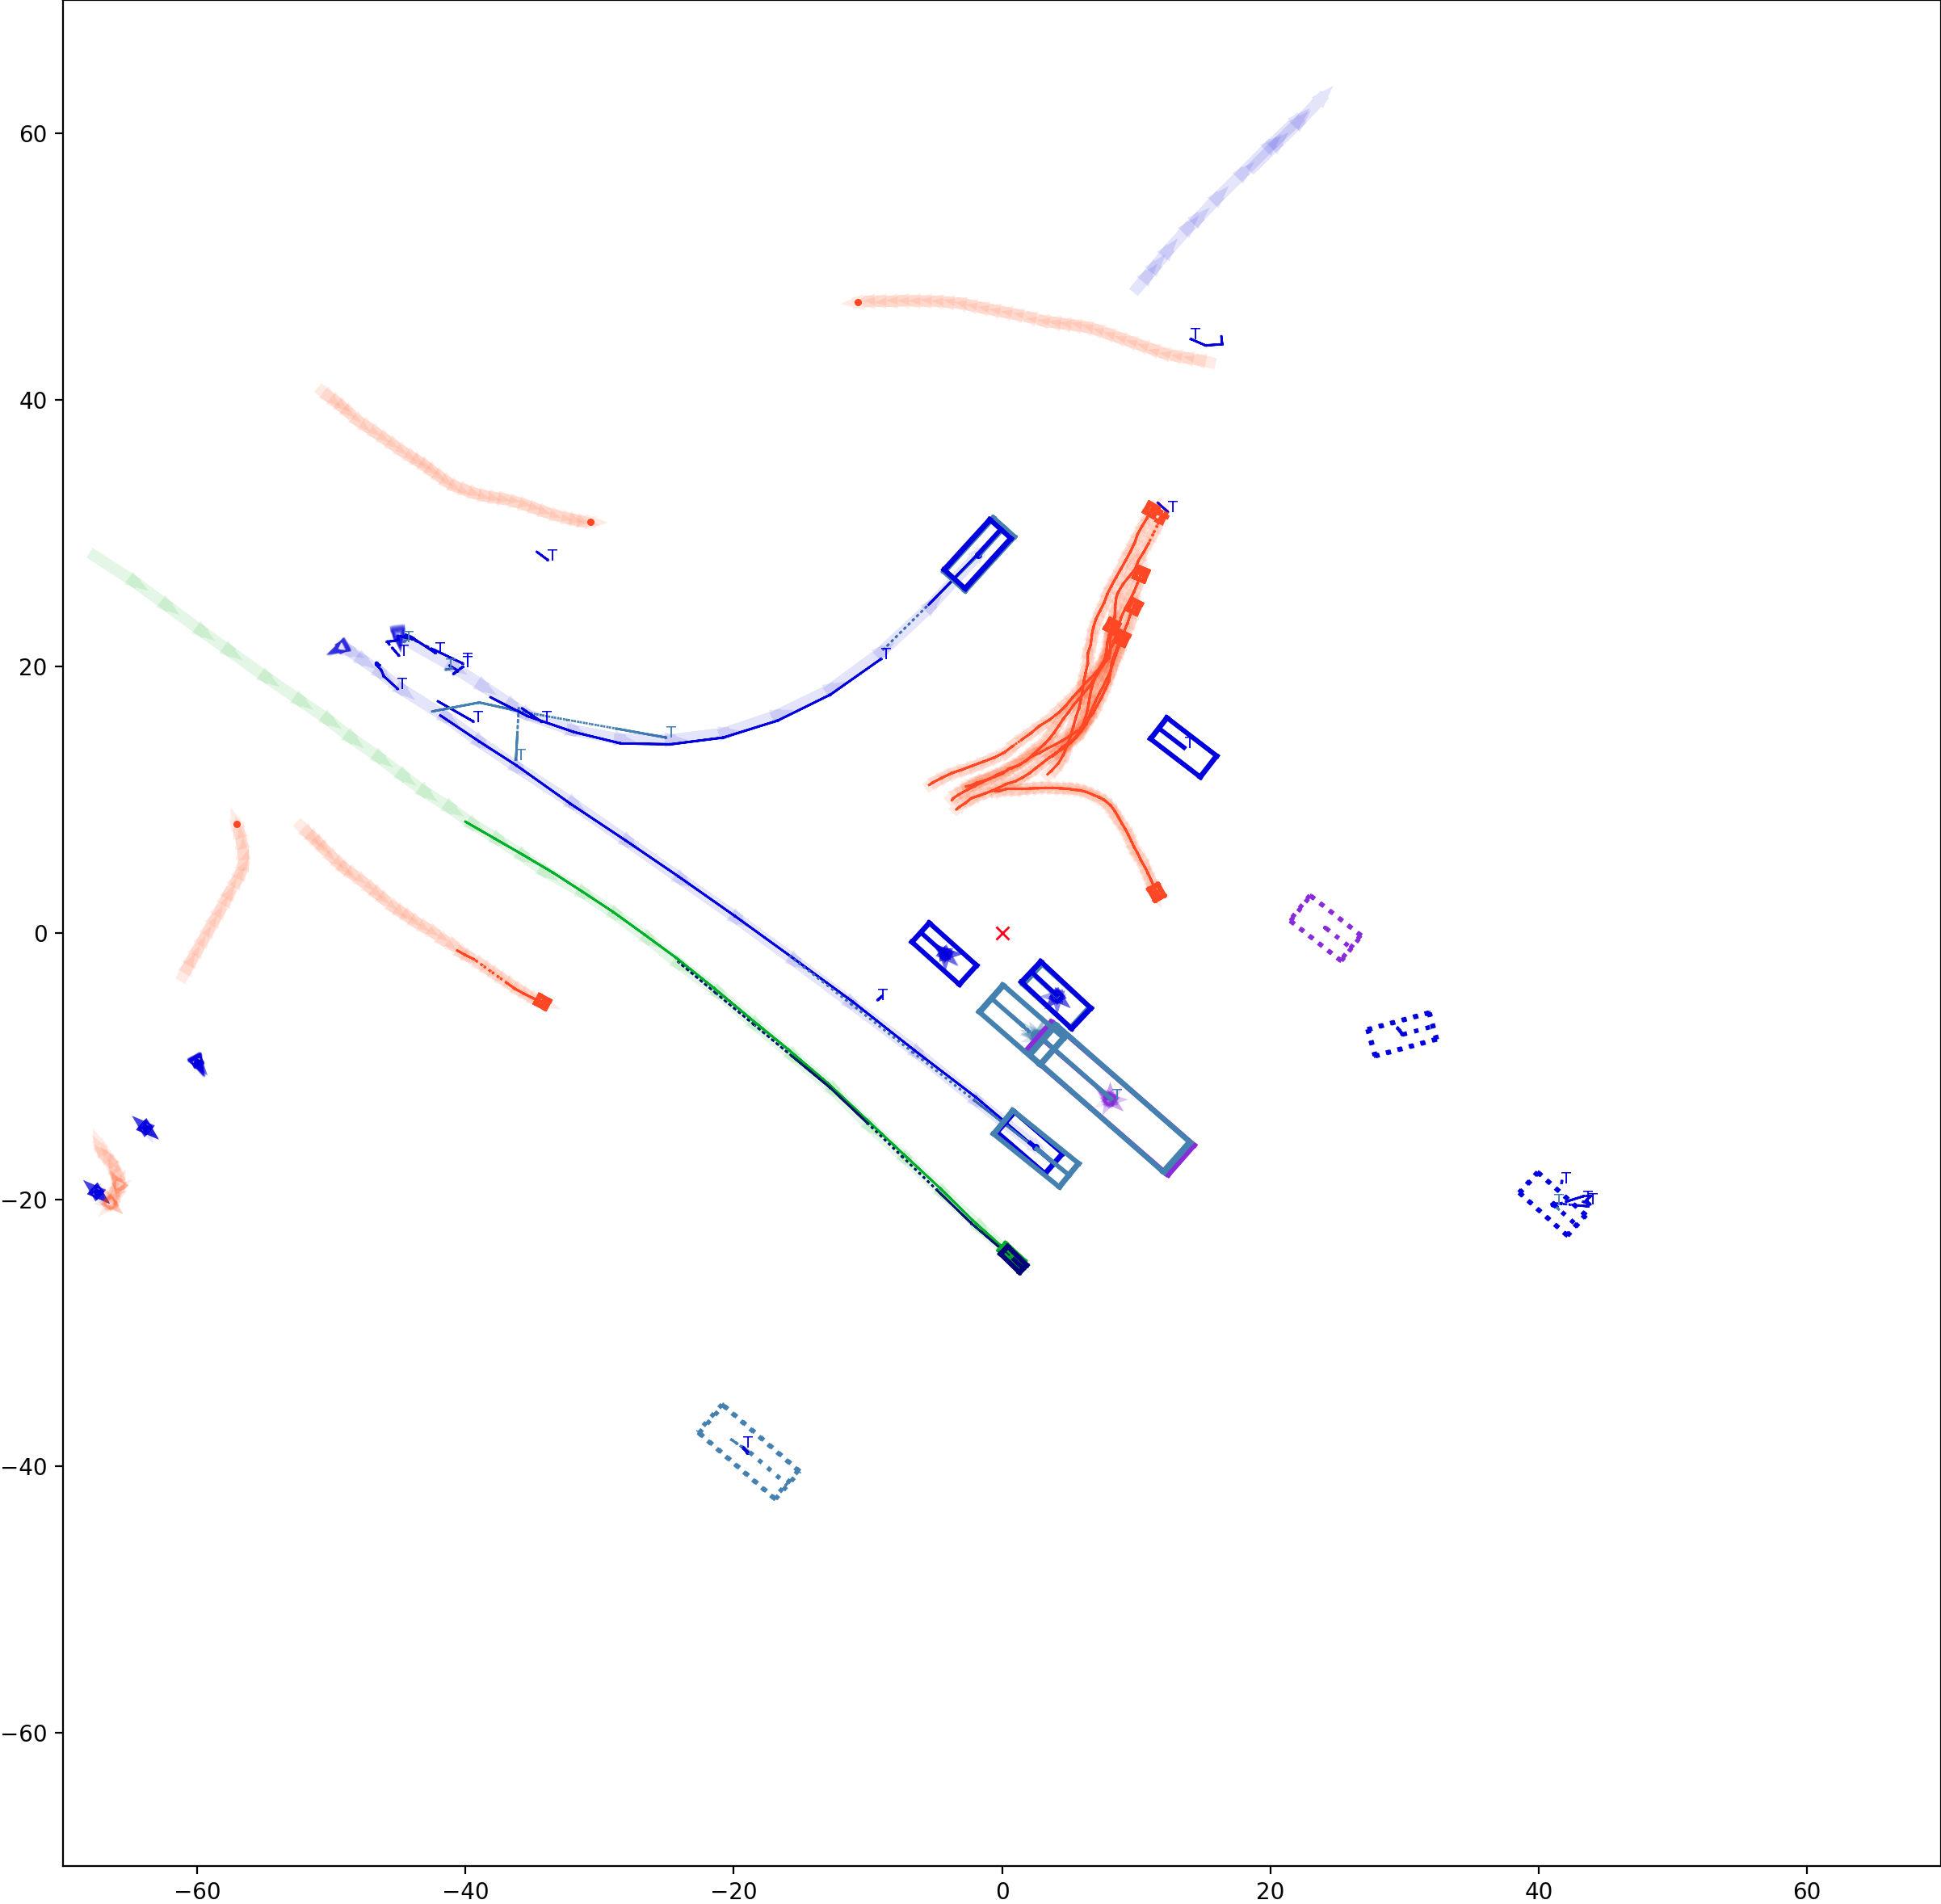
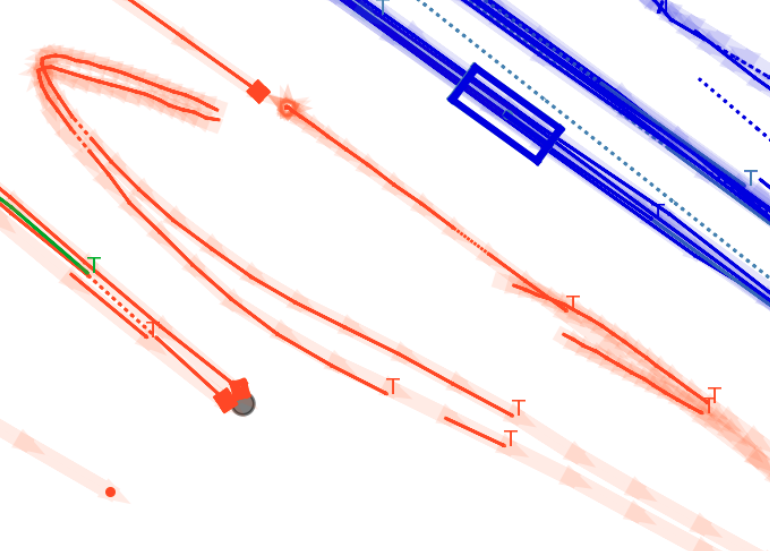
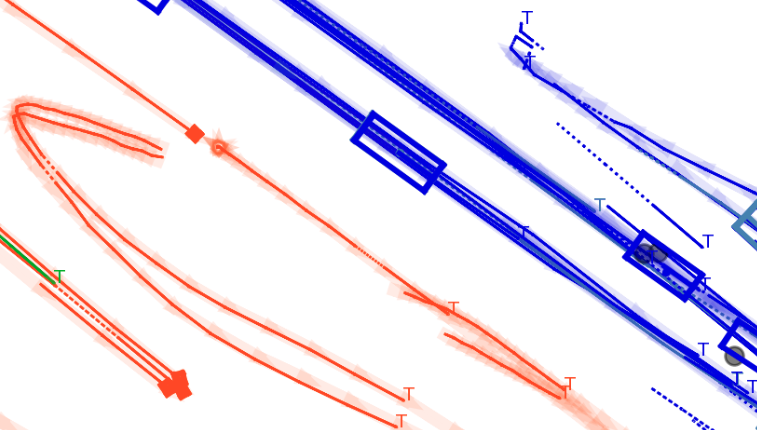
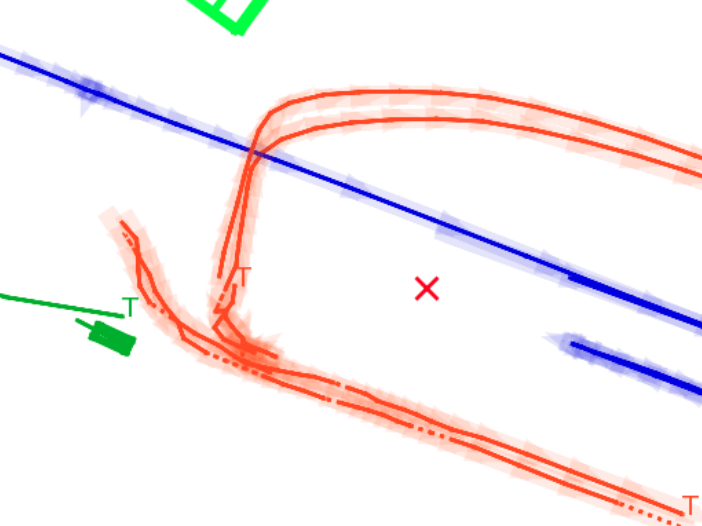
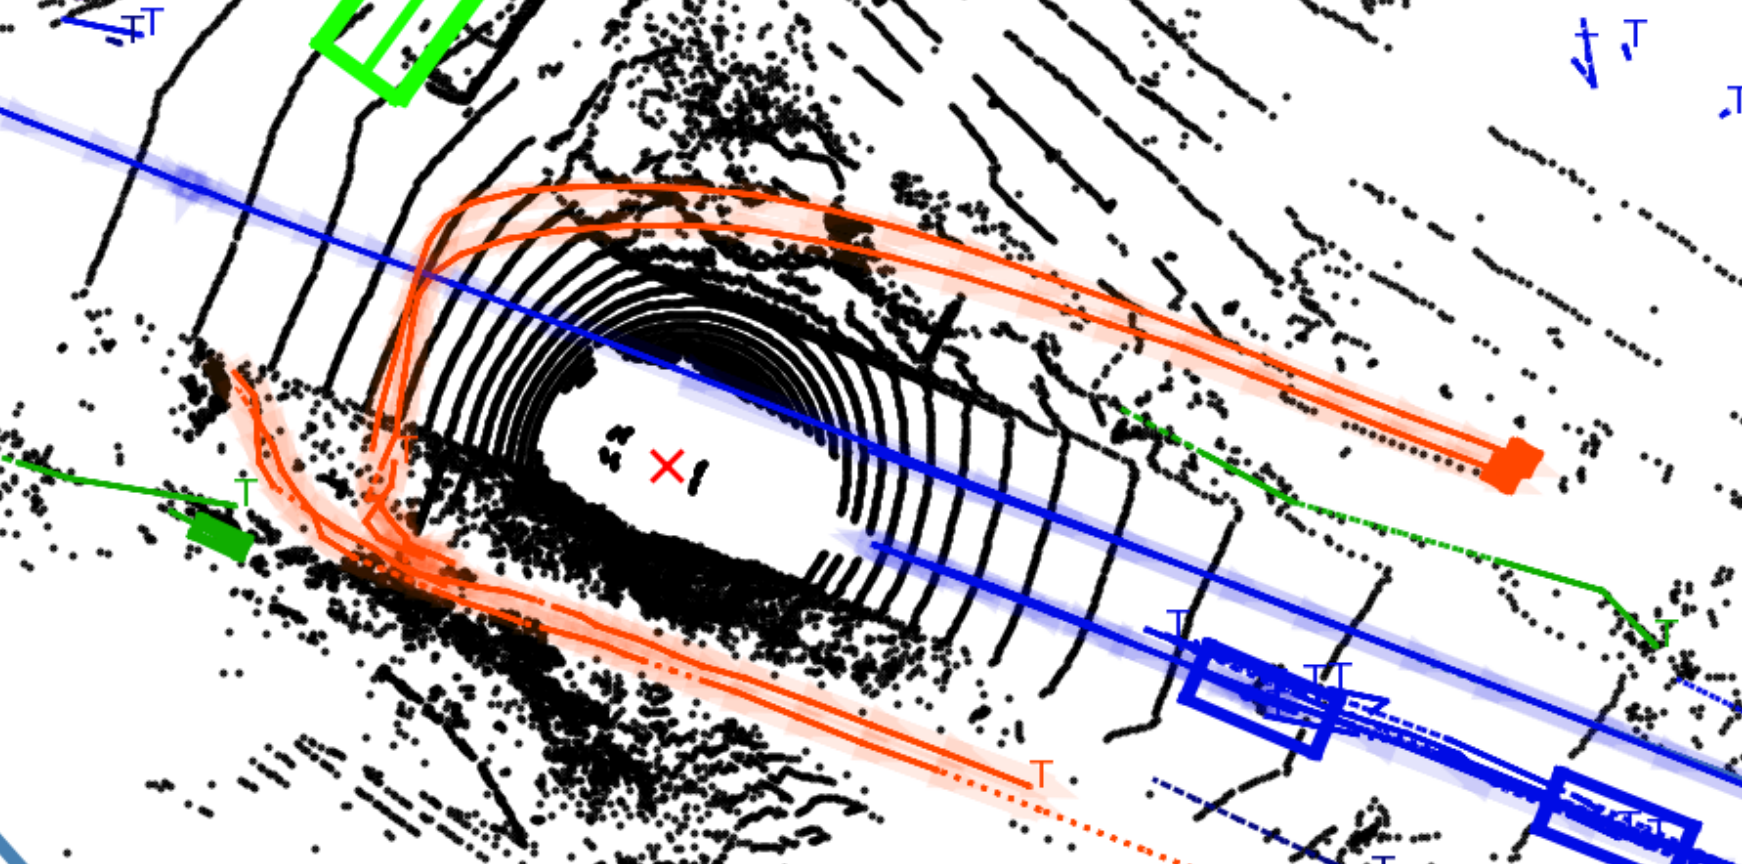
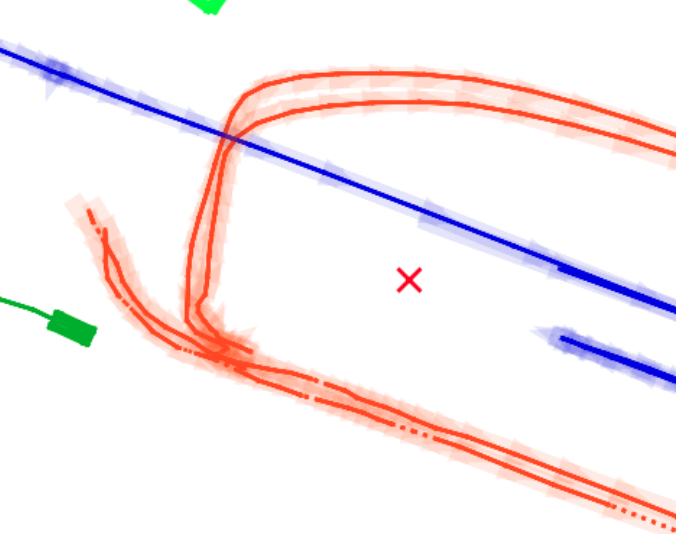
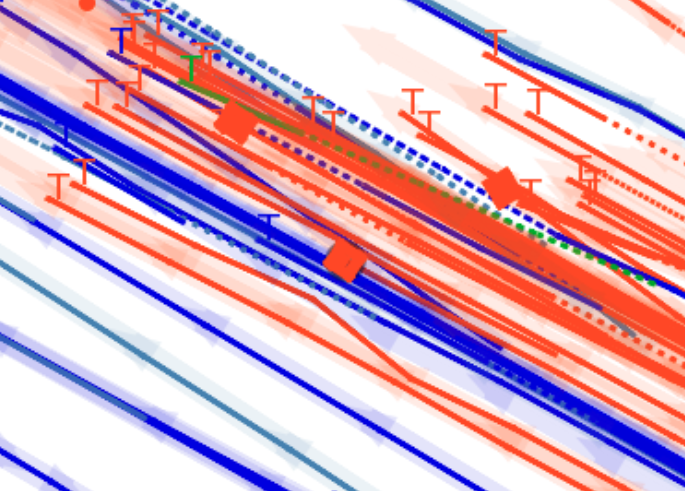
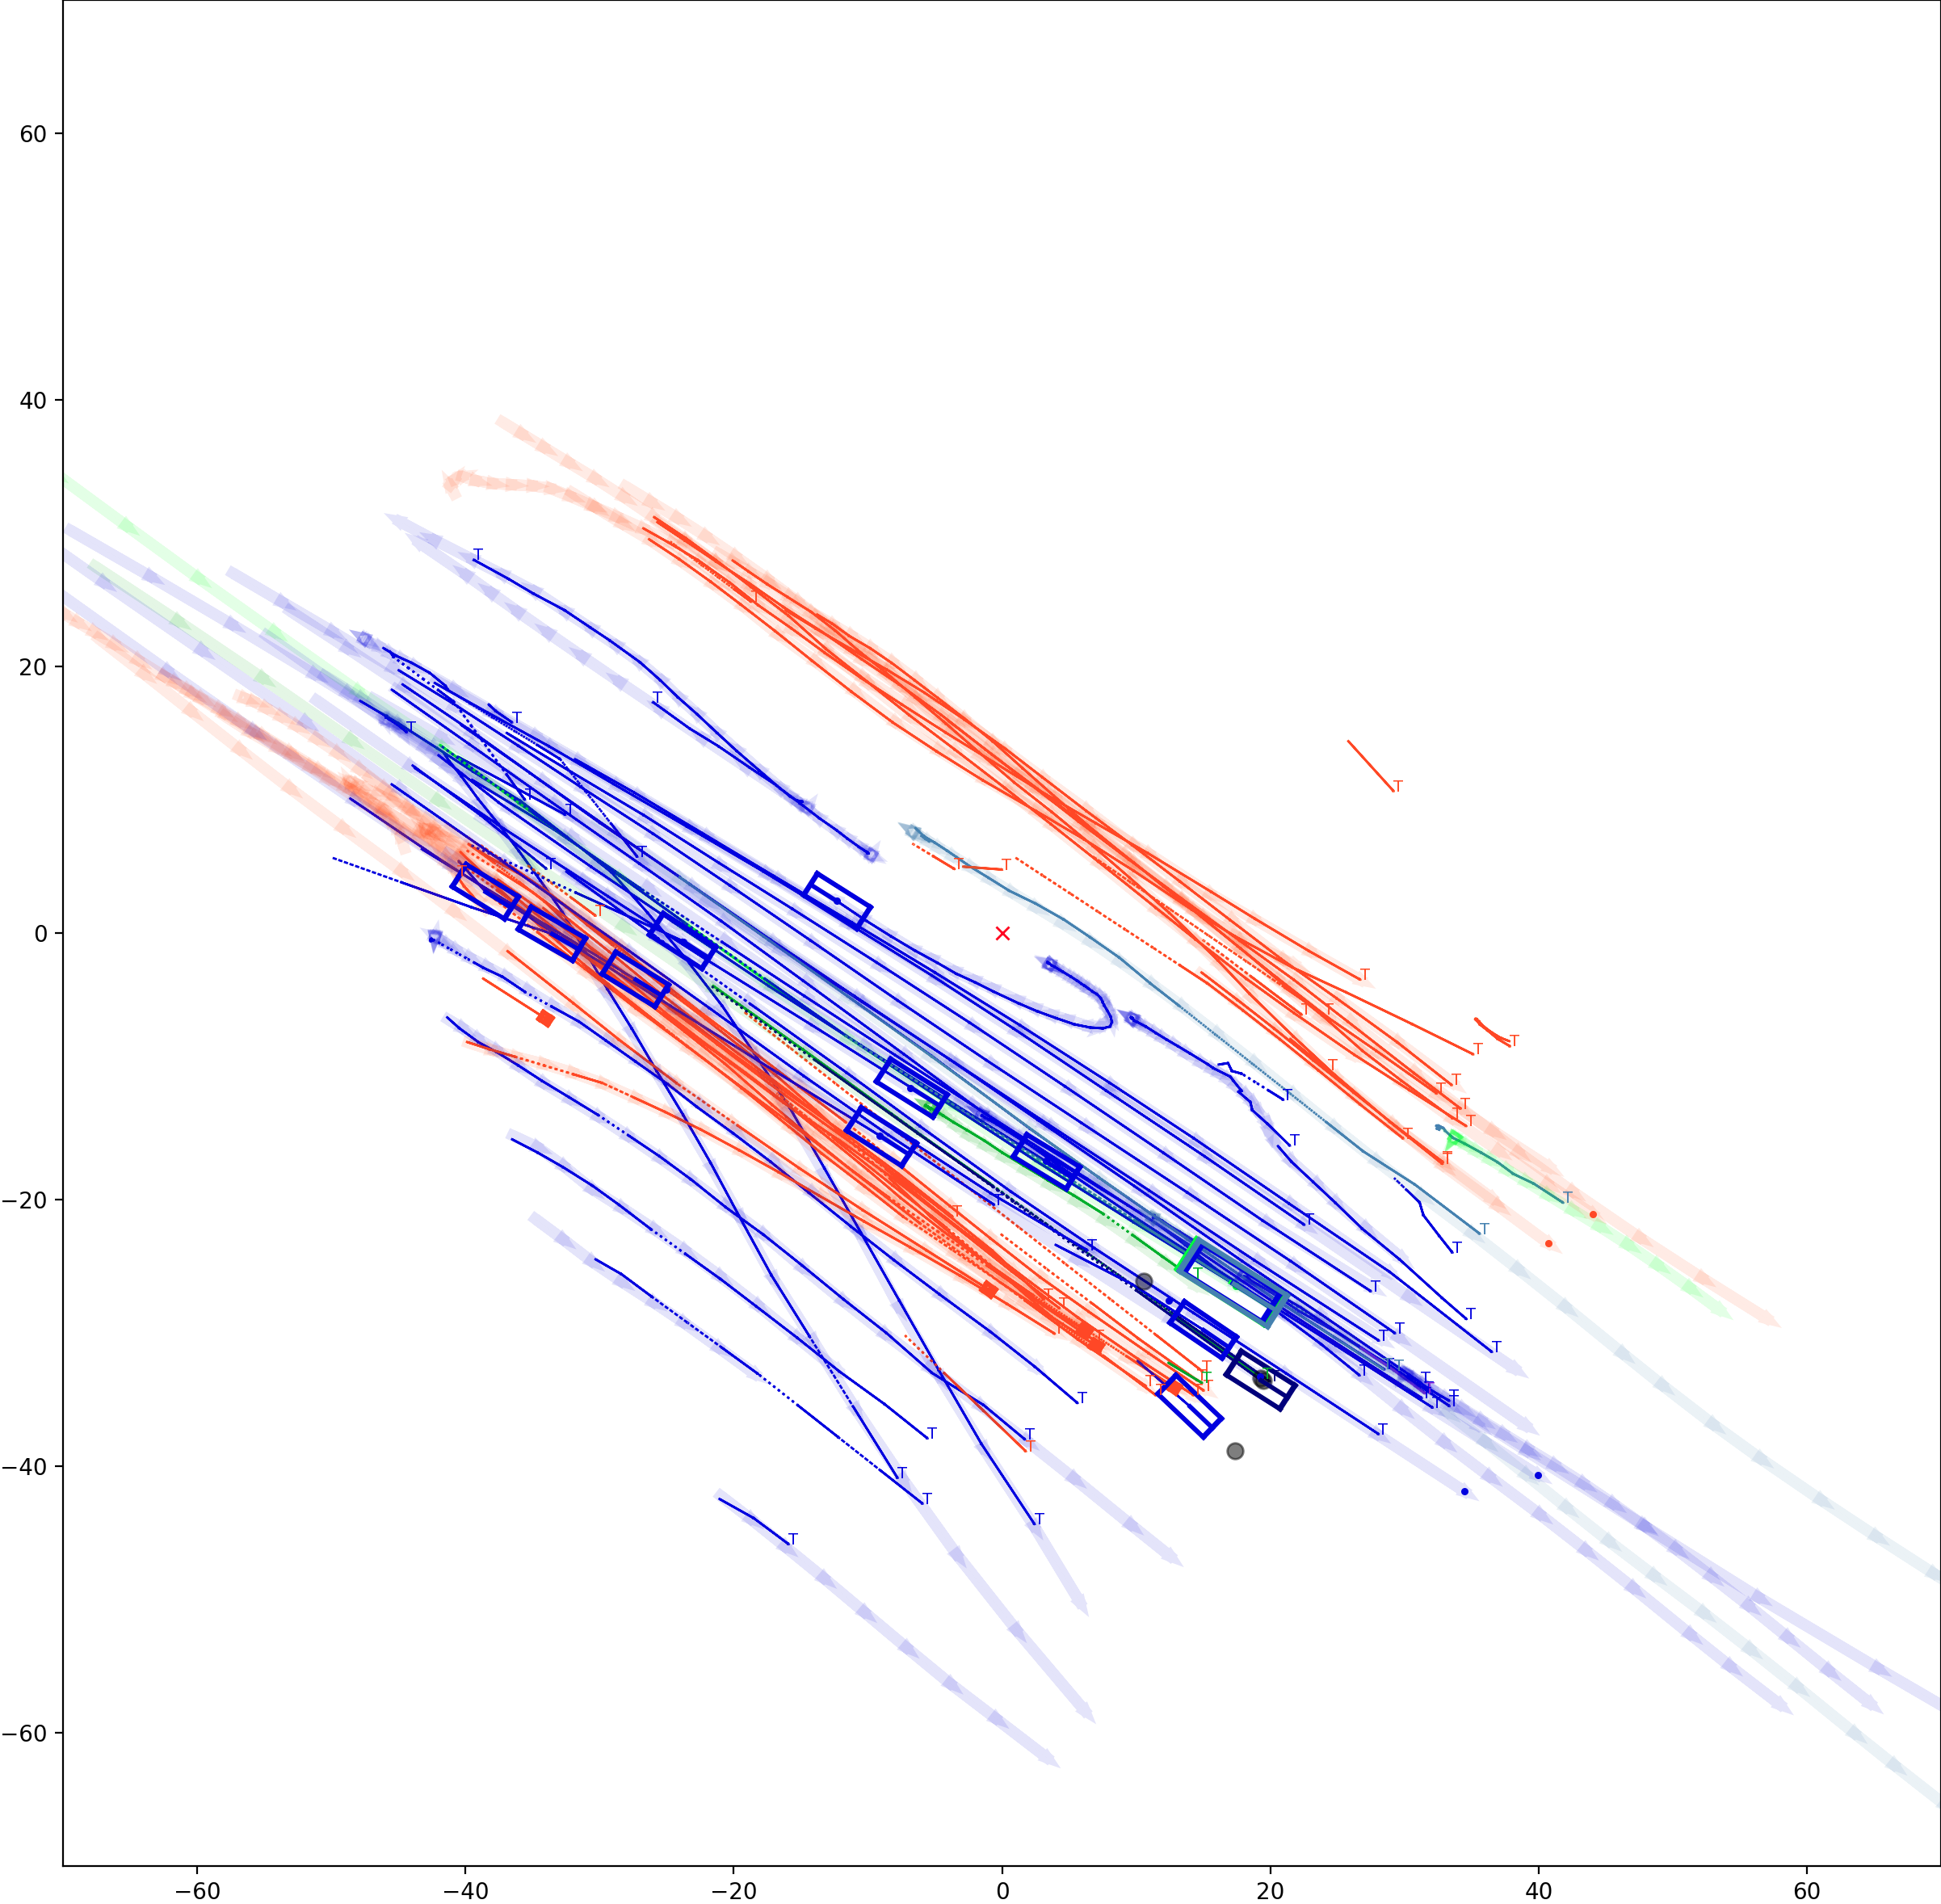
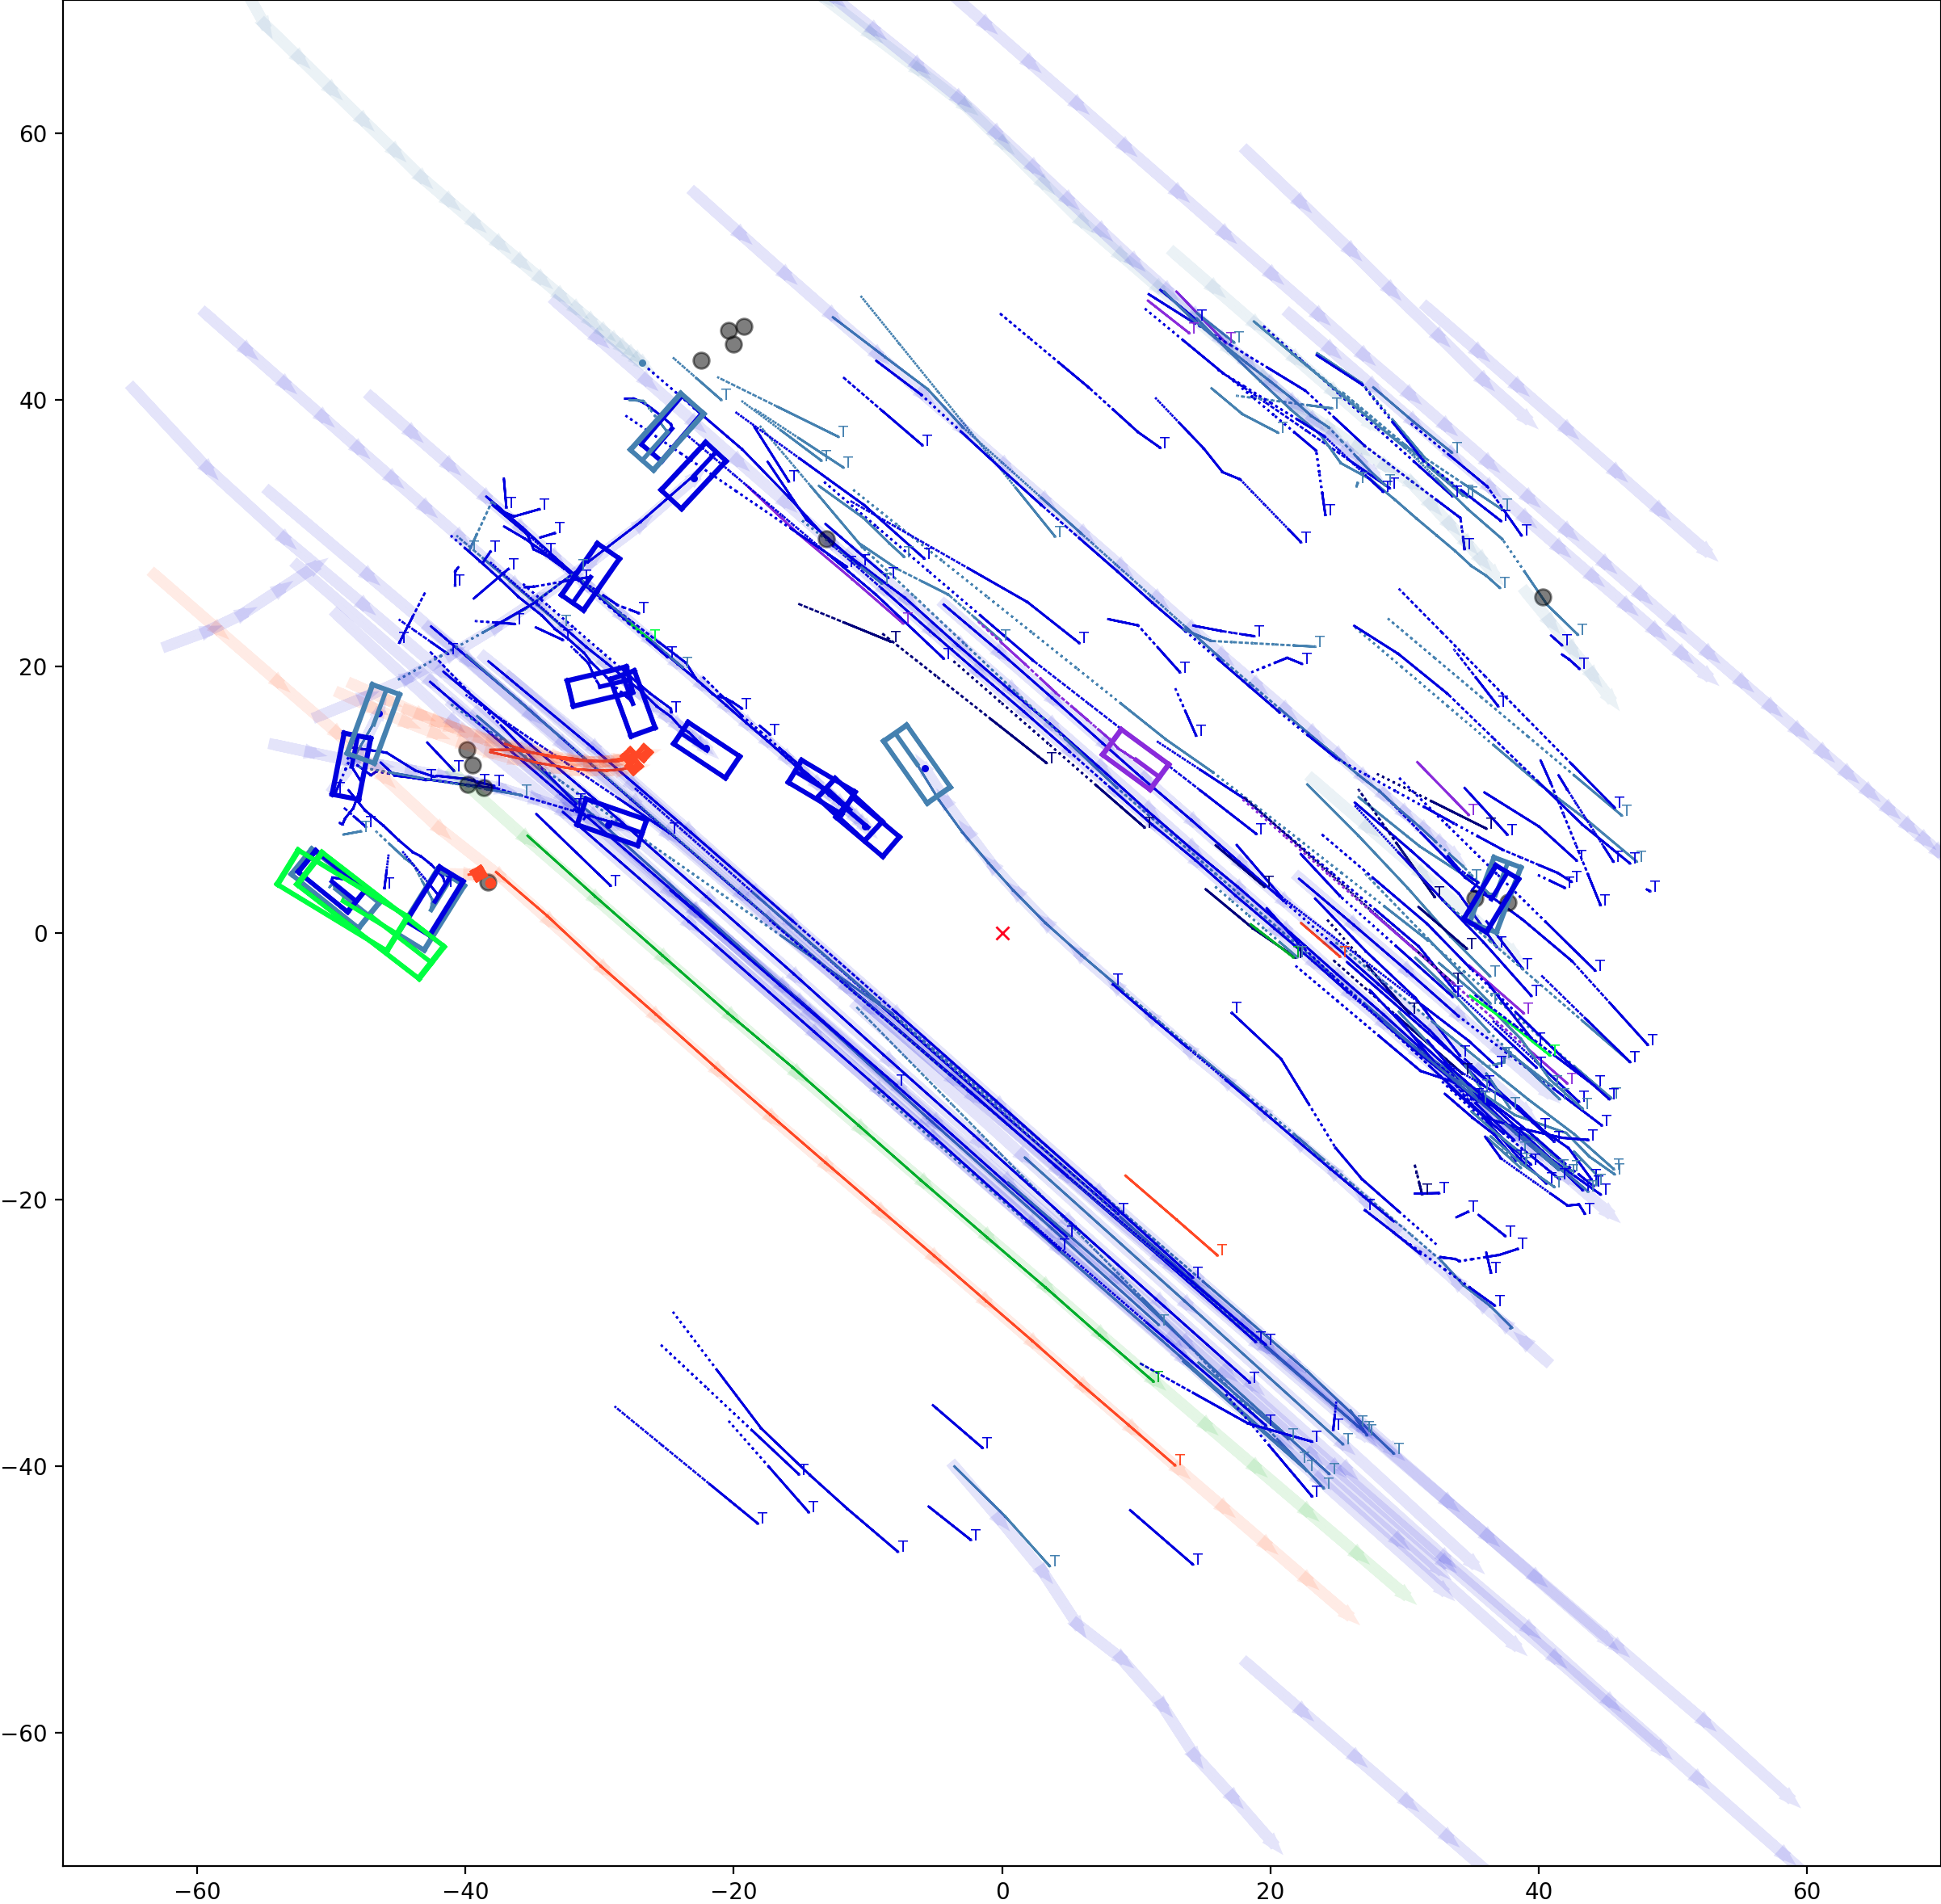
The analysis documents identity changes when tracks intersect, including an example of two bus tracks that terminate and restart.
Implication: inspect the competing associations around the intersection, including tracks that temporarily have no detection.
Two intersecting bus tracks; the original caption records termination and restart.
A local repair can hurt the overall score. The analysis reports a drop from 0.707 to 0.69 after lowering the birth rate: some broken tracks improve, but incorrect associations become more common. This is an earlier tuning observation, separate from the 0.761 validation run above.
0.707Earlier reported score
→
0.690After reducing birth rate
These two values are reported in the archived analysis; the corresponding complete configurations are not supplied there.
Inspect the original sequences
Select an example to play its archived animation at 2× speed in a continuous loop.
04 / Method comparison
Different approximations, different failure modes.
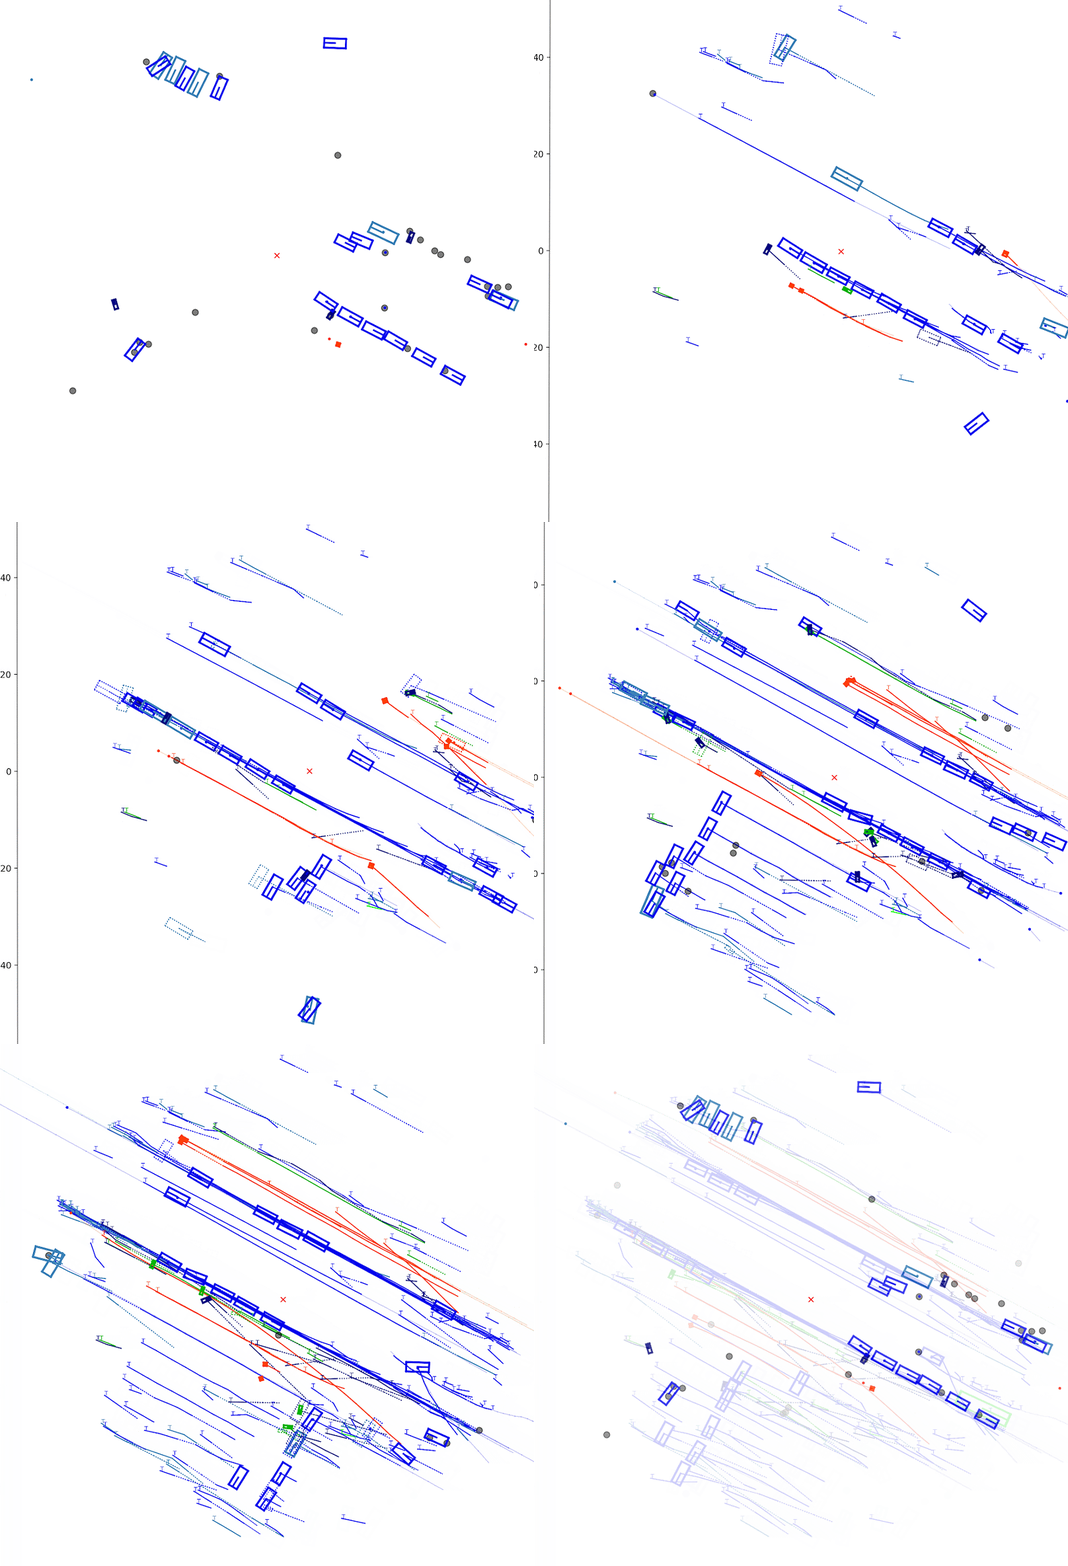
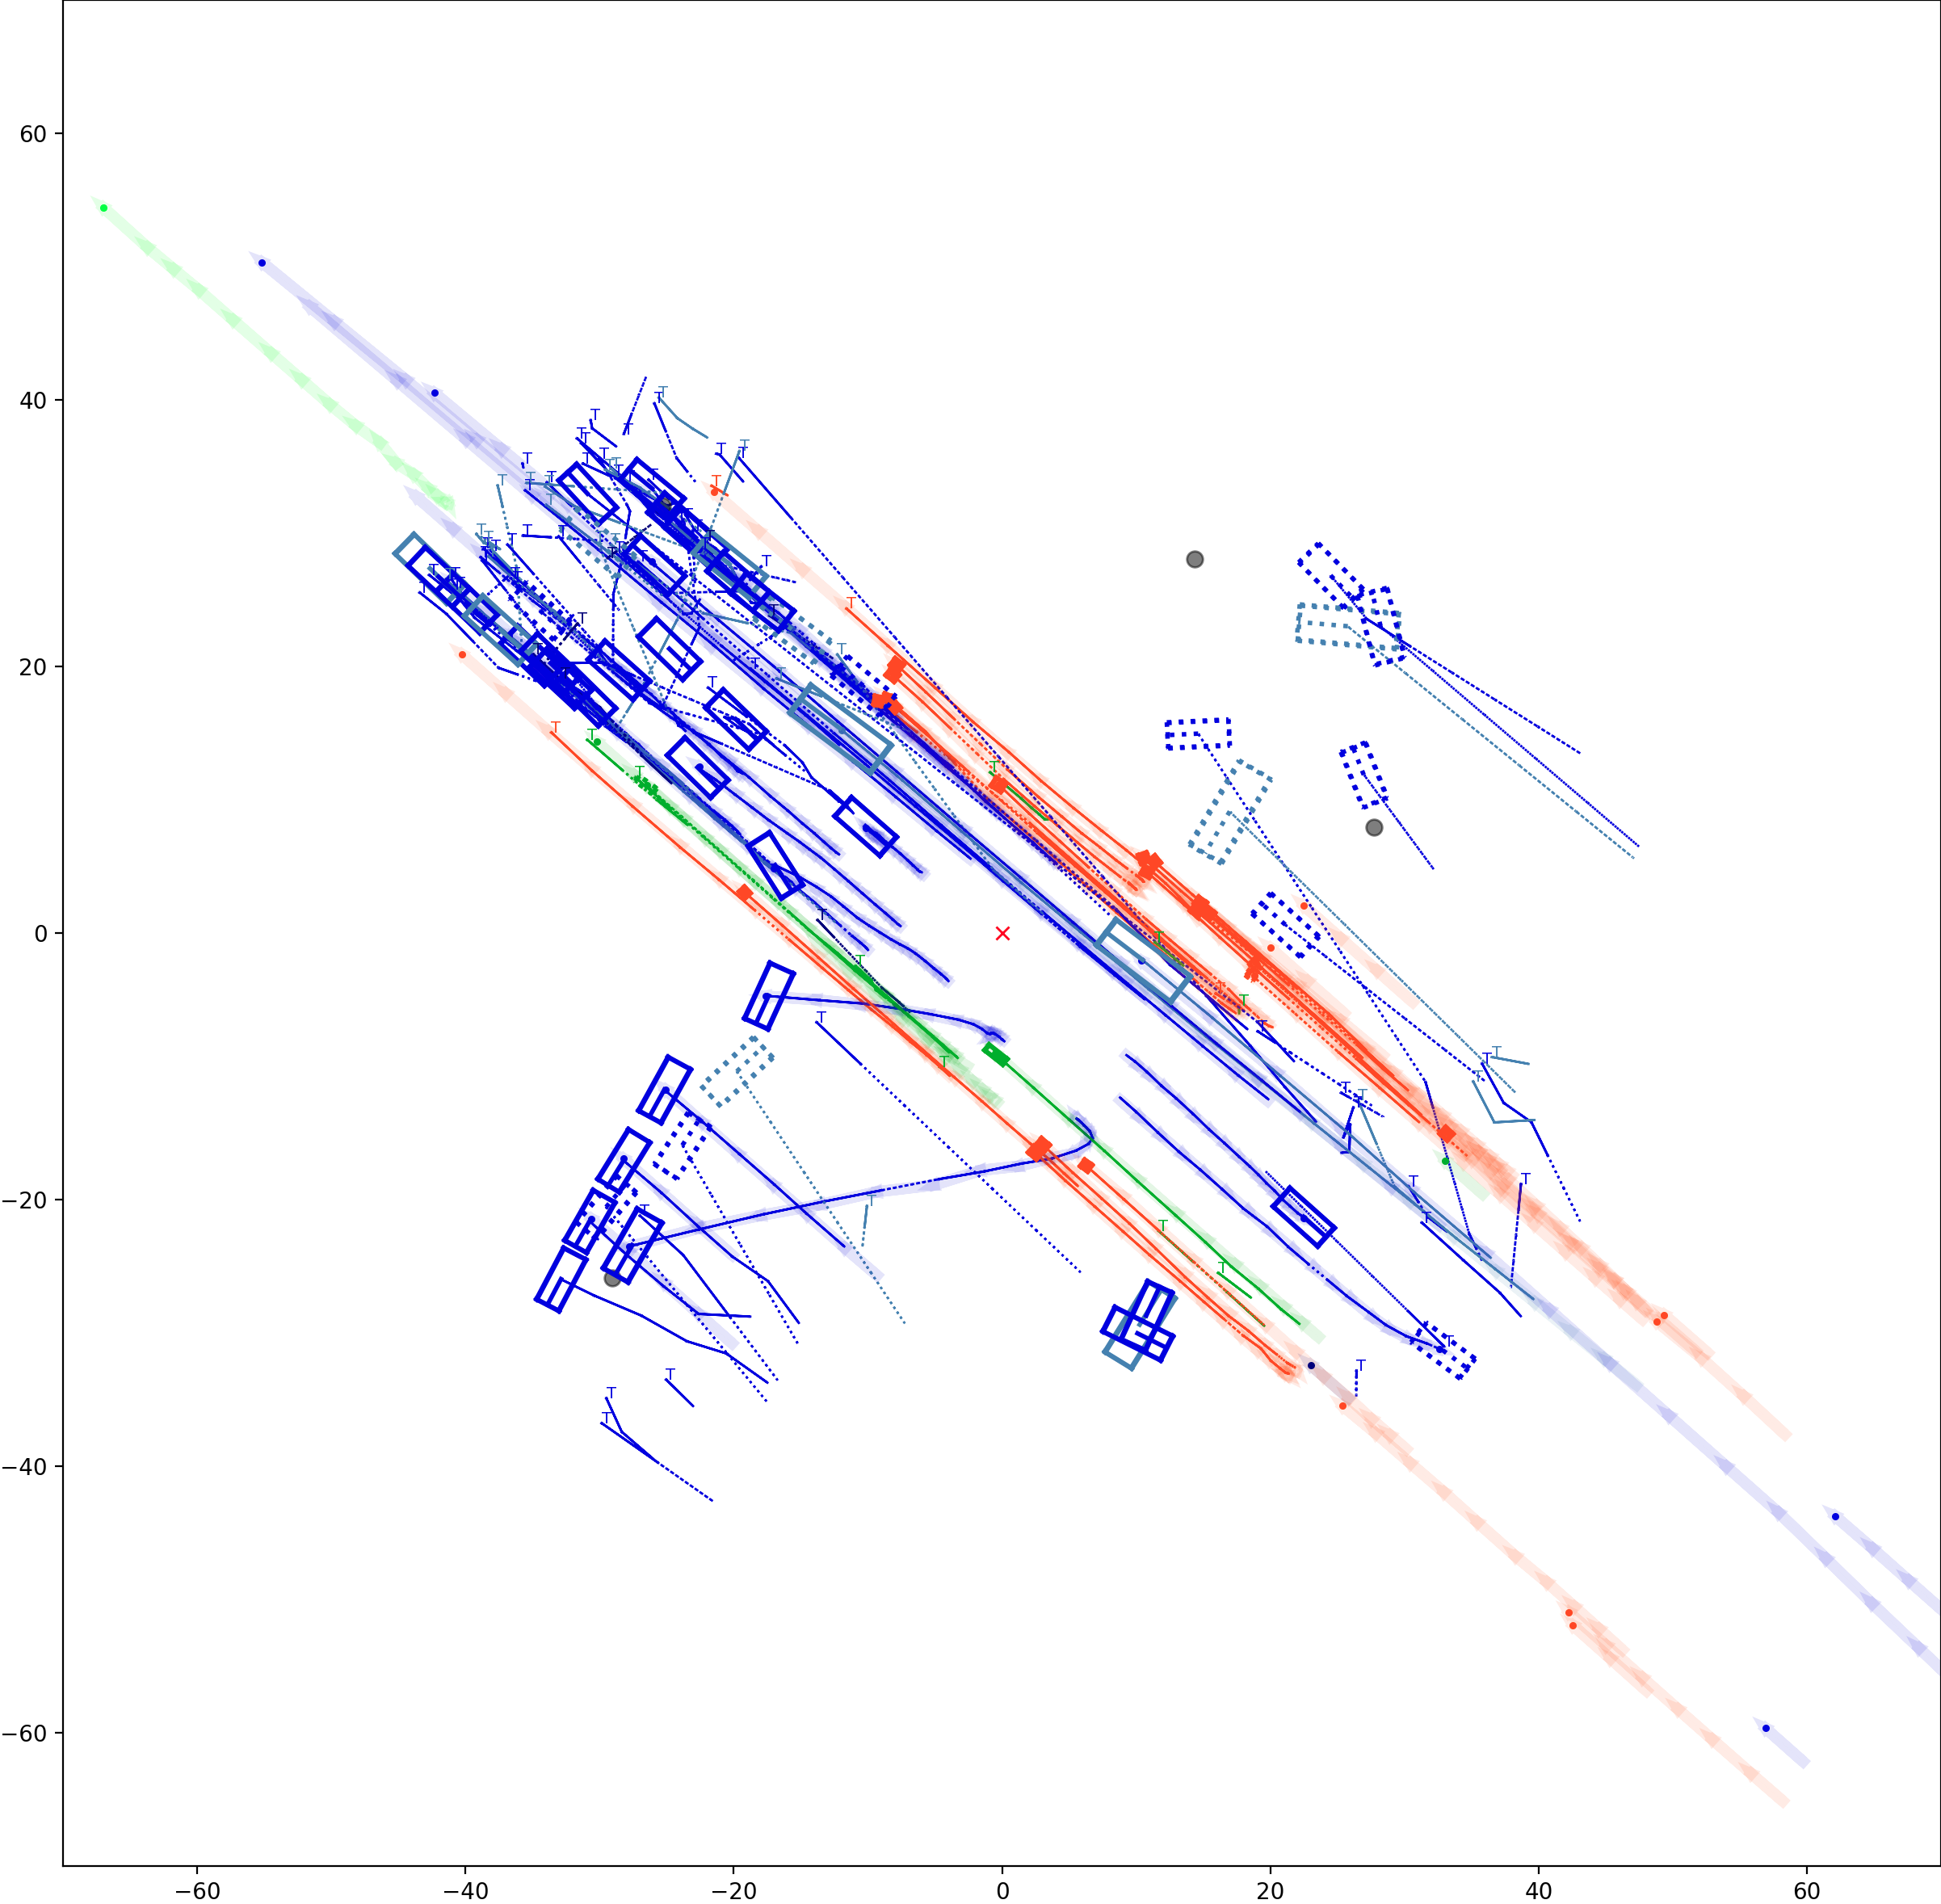
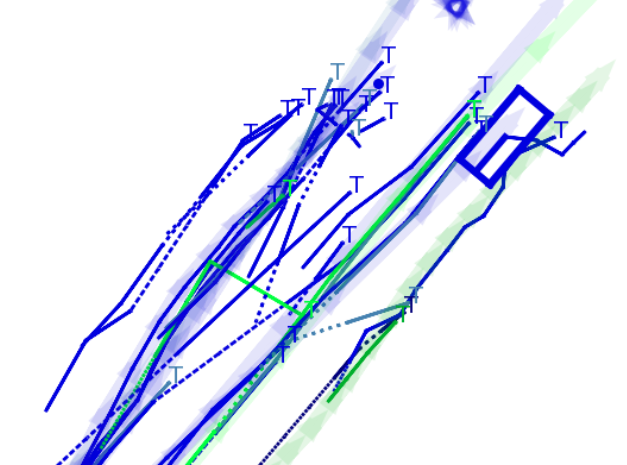
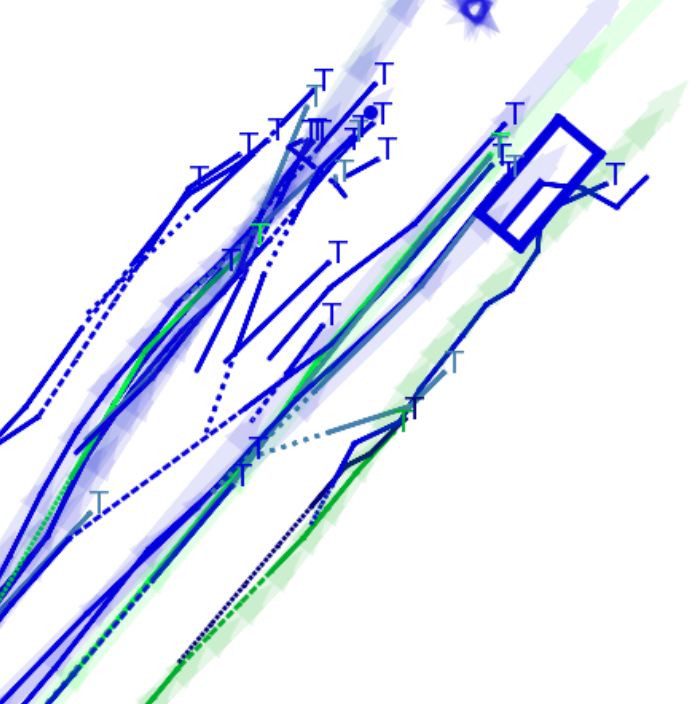
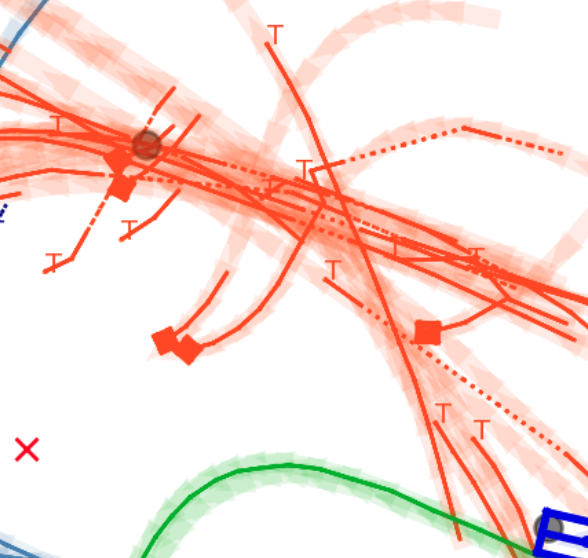
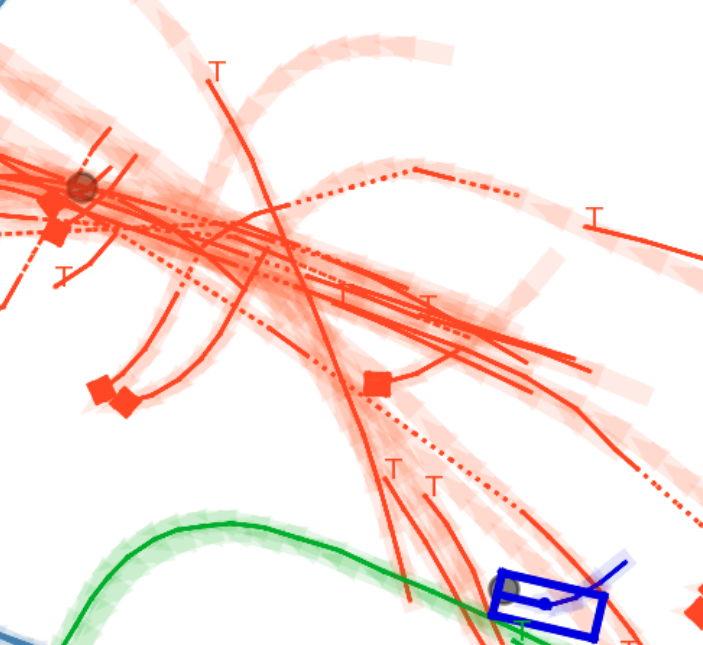
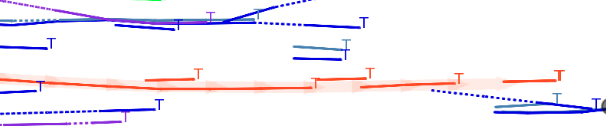
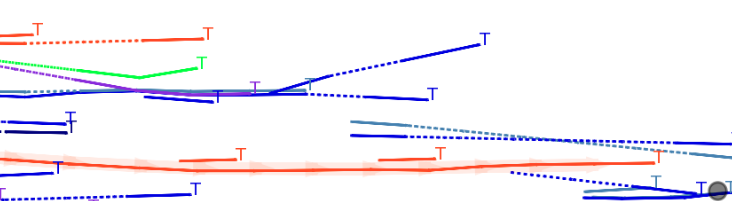
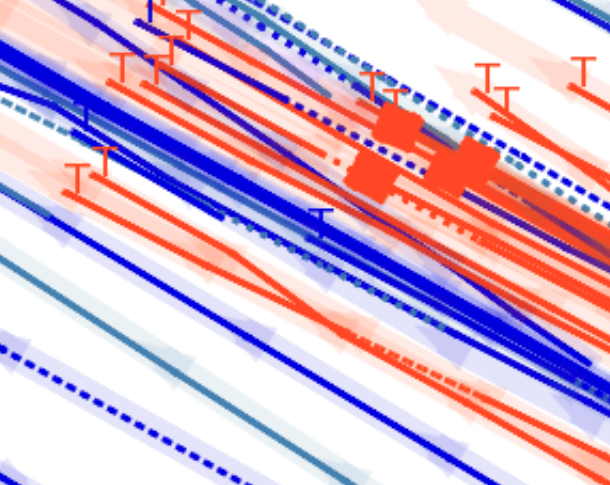
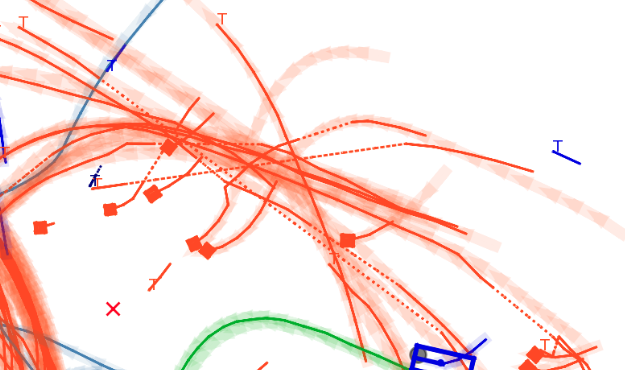
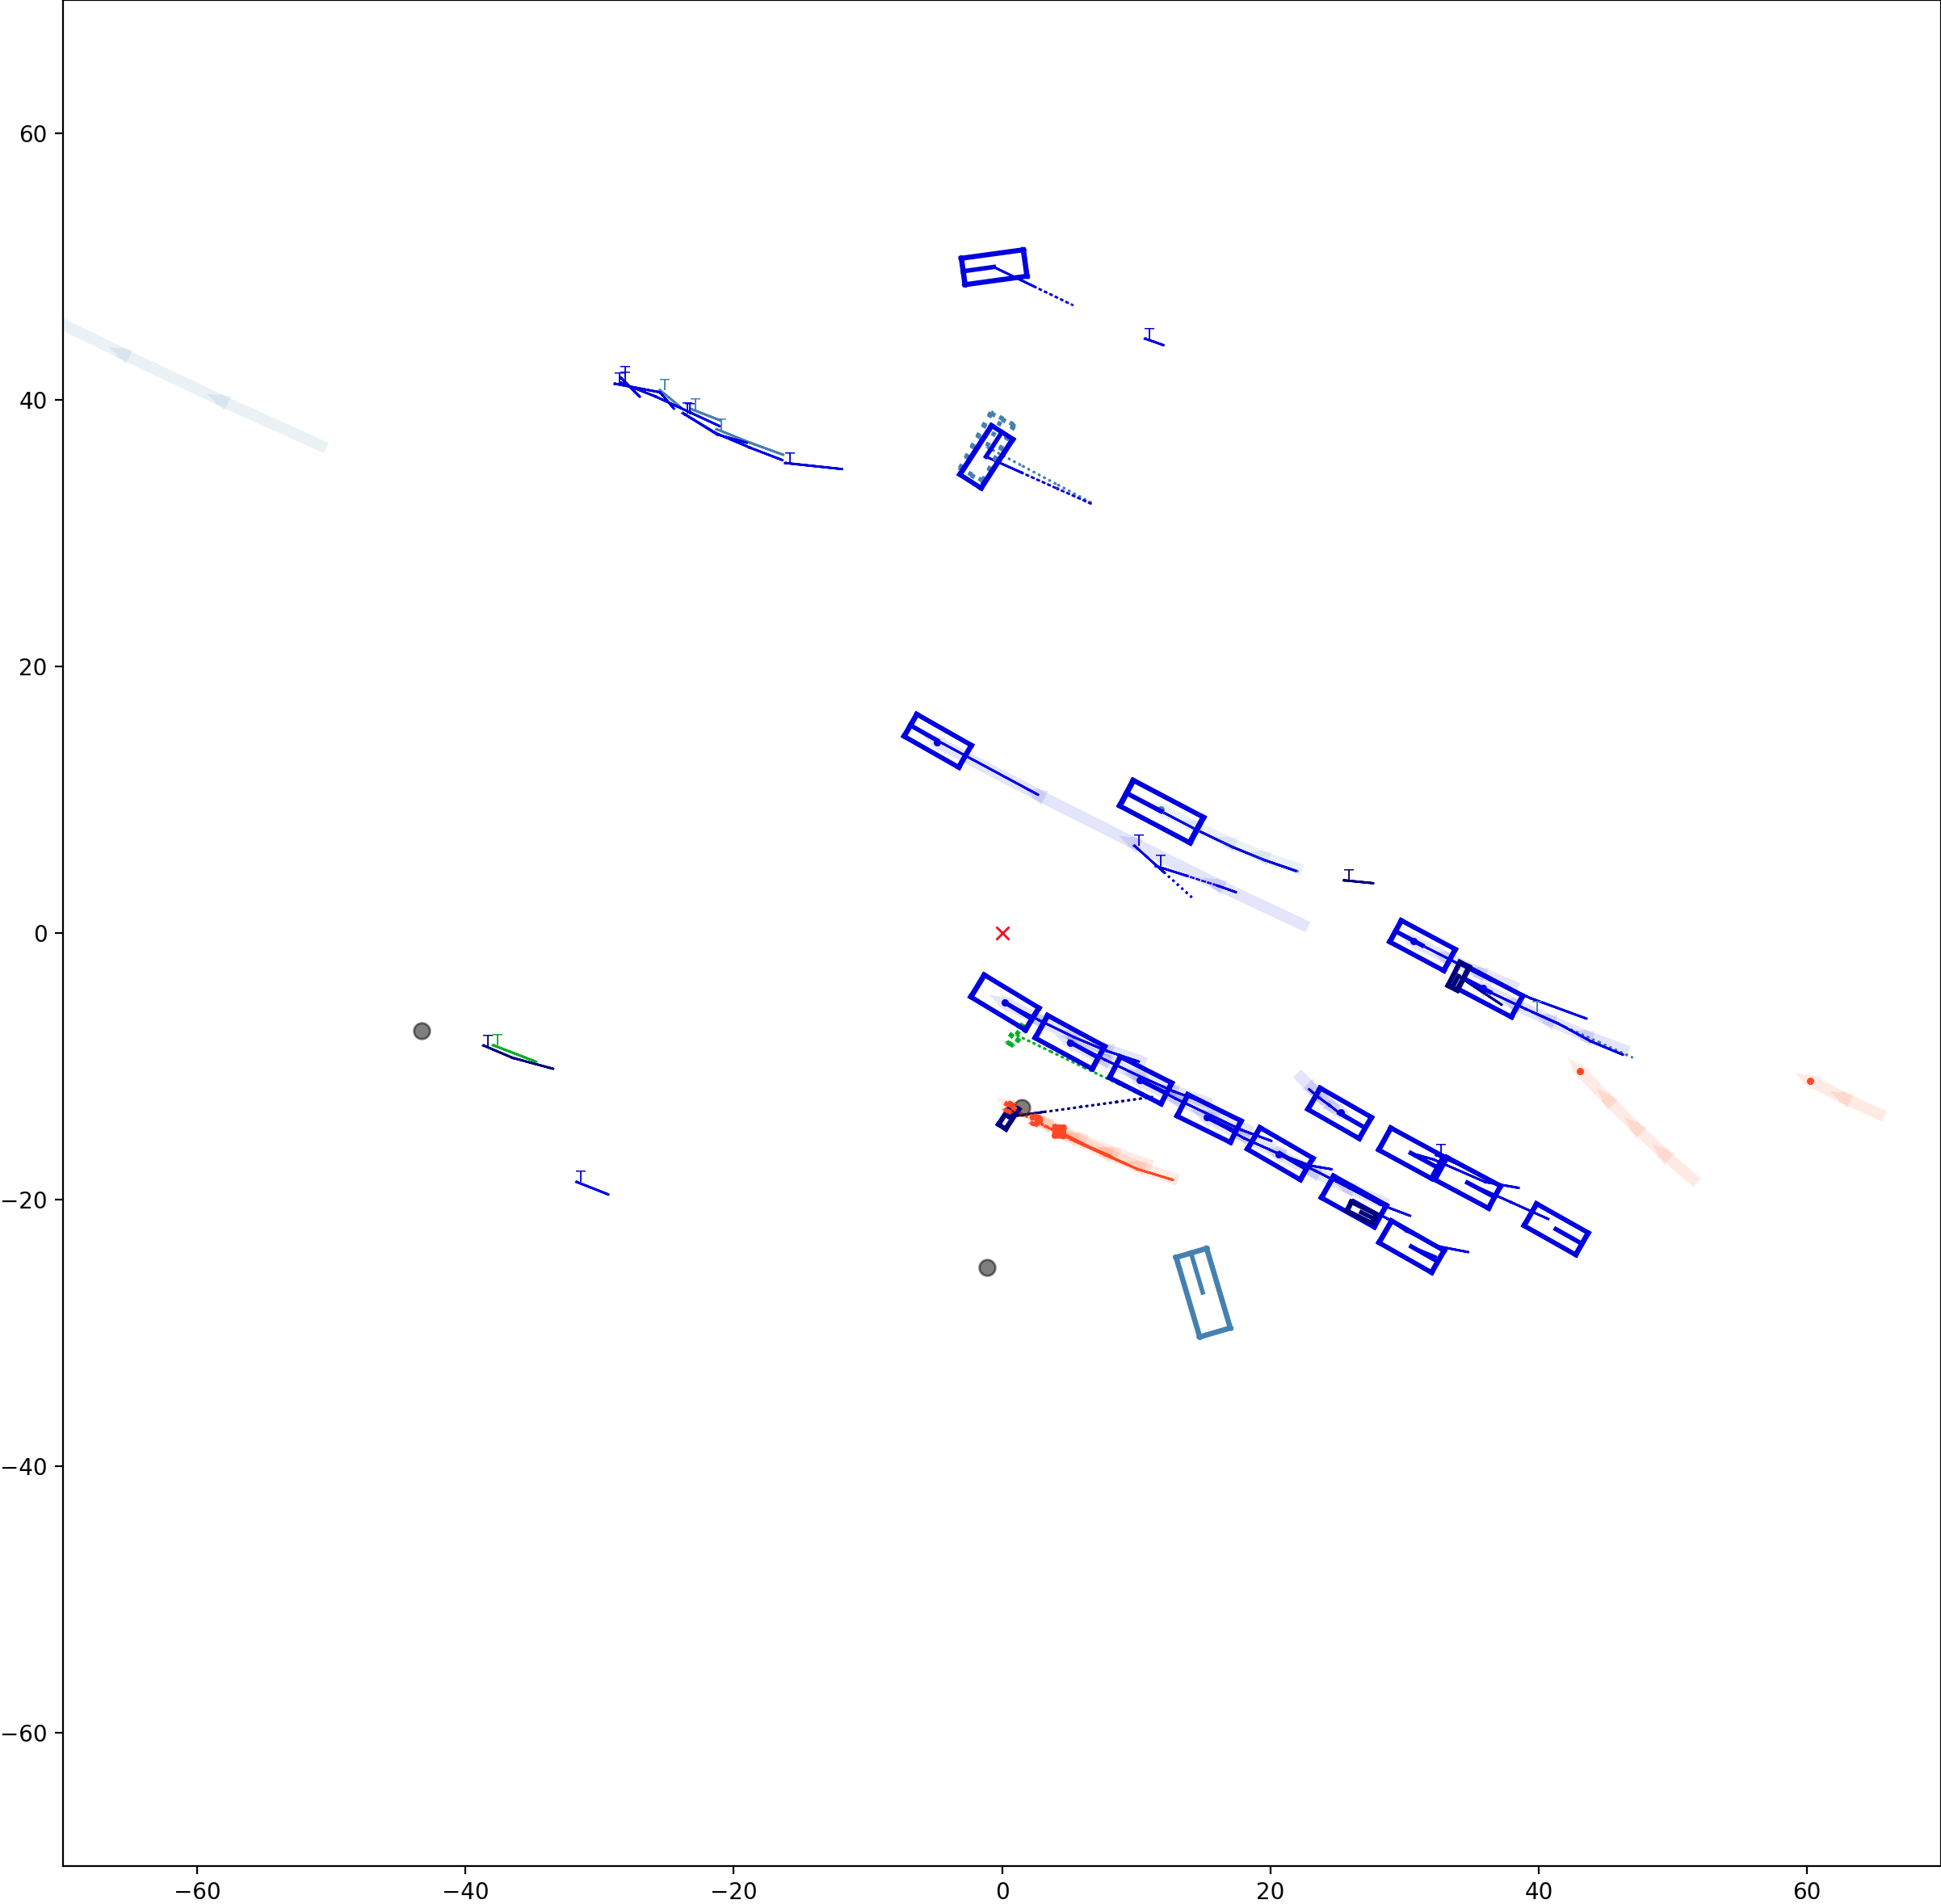
The source compares outputs labeled MHT and TO-PMB (track-oriented Poisson multi-Bernoulli). These paired visual examples describe individual behavior; they do not establish an overall ranking.
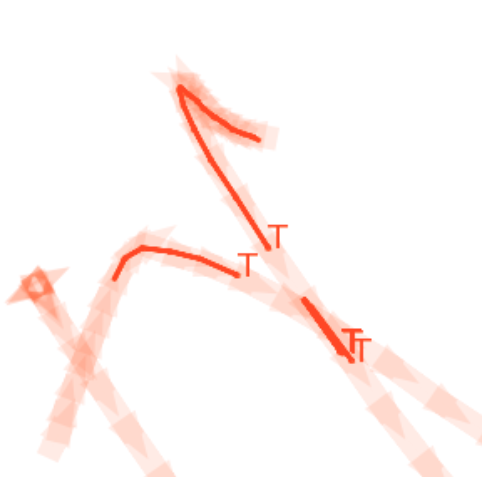
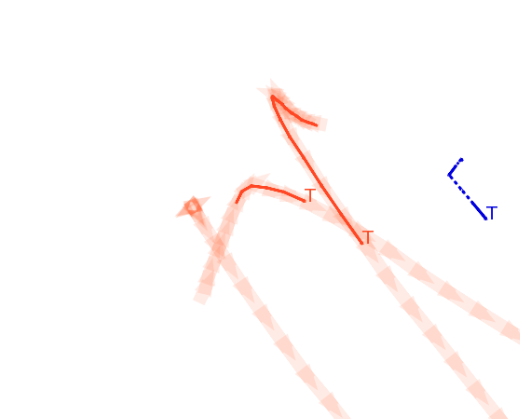
MHT, as labeled in the analysis. The source identifies a preference for terminating the track.TO-PMB. The corresponding output for the same source track.
Hypothesis selection
The analysis identifies early termination and sudden position changes in selected MHT outputs. Inspect which association history is retained when several explanations compete.
Coalescence and long links
A separate group records track coalescence and associations made over large distances. Preserving a track is useful only when the identity and trajectory remain credible.
Method labels are preserved from the archived observations. Exact code-to-figure configurations are not available for every pair. Browse all comparison figures.
05 / Lessons and next experiments
Turn observations into specific tests.
The archive suggests several directions. They are presented as research questions, not as demonstrated improvements.
Adapt birth behavior to the scene.The analysis proposes stronger birth intensity in crowded regions and lower intensity in sparse regions. Compare against fixed rates using identical detections and evaluation settings.
Accumulate class evidence over time.Test whether a temporal class model reduces the documented label-change failures without introducing incorrect identities.
Revisit motion and survival through gaps.Separate turning errors from occlusion errors; measure continuity and incorrect associations as well as the average score.
Preserve experiment provenance.Save the detector checkpoint, tracker settings, split, code revision, and per-class metrics with every new run so that visual examples and scores can be compared reliably.
06 / Evidence library
The original figure archive.
73 image entries from the research archive, including 5 animations. Original captions are retained. GIFs play at 2× speed and loop continuously; repeated figures remain separate entries.
Open a category to inspect its figures. Select any image to view it at full resolution. Some source captions contain only a track token; these are retained without adding an unsupported diagnosis.
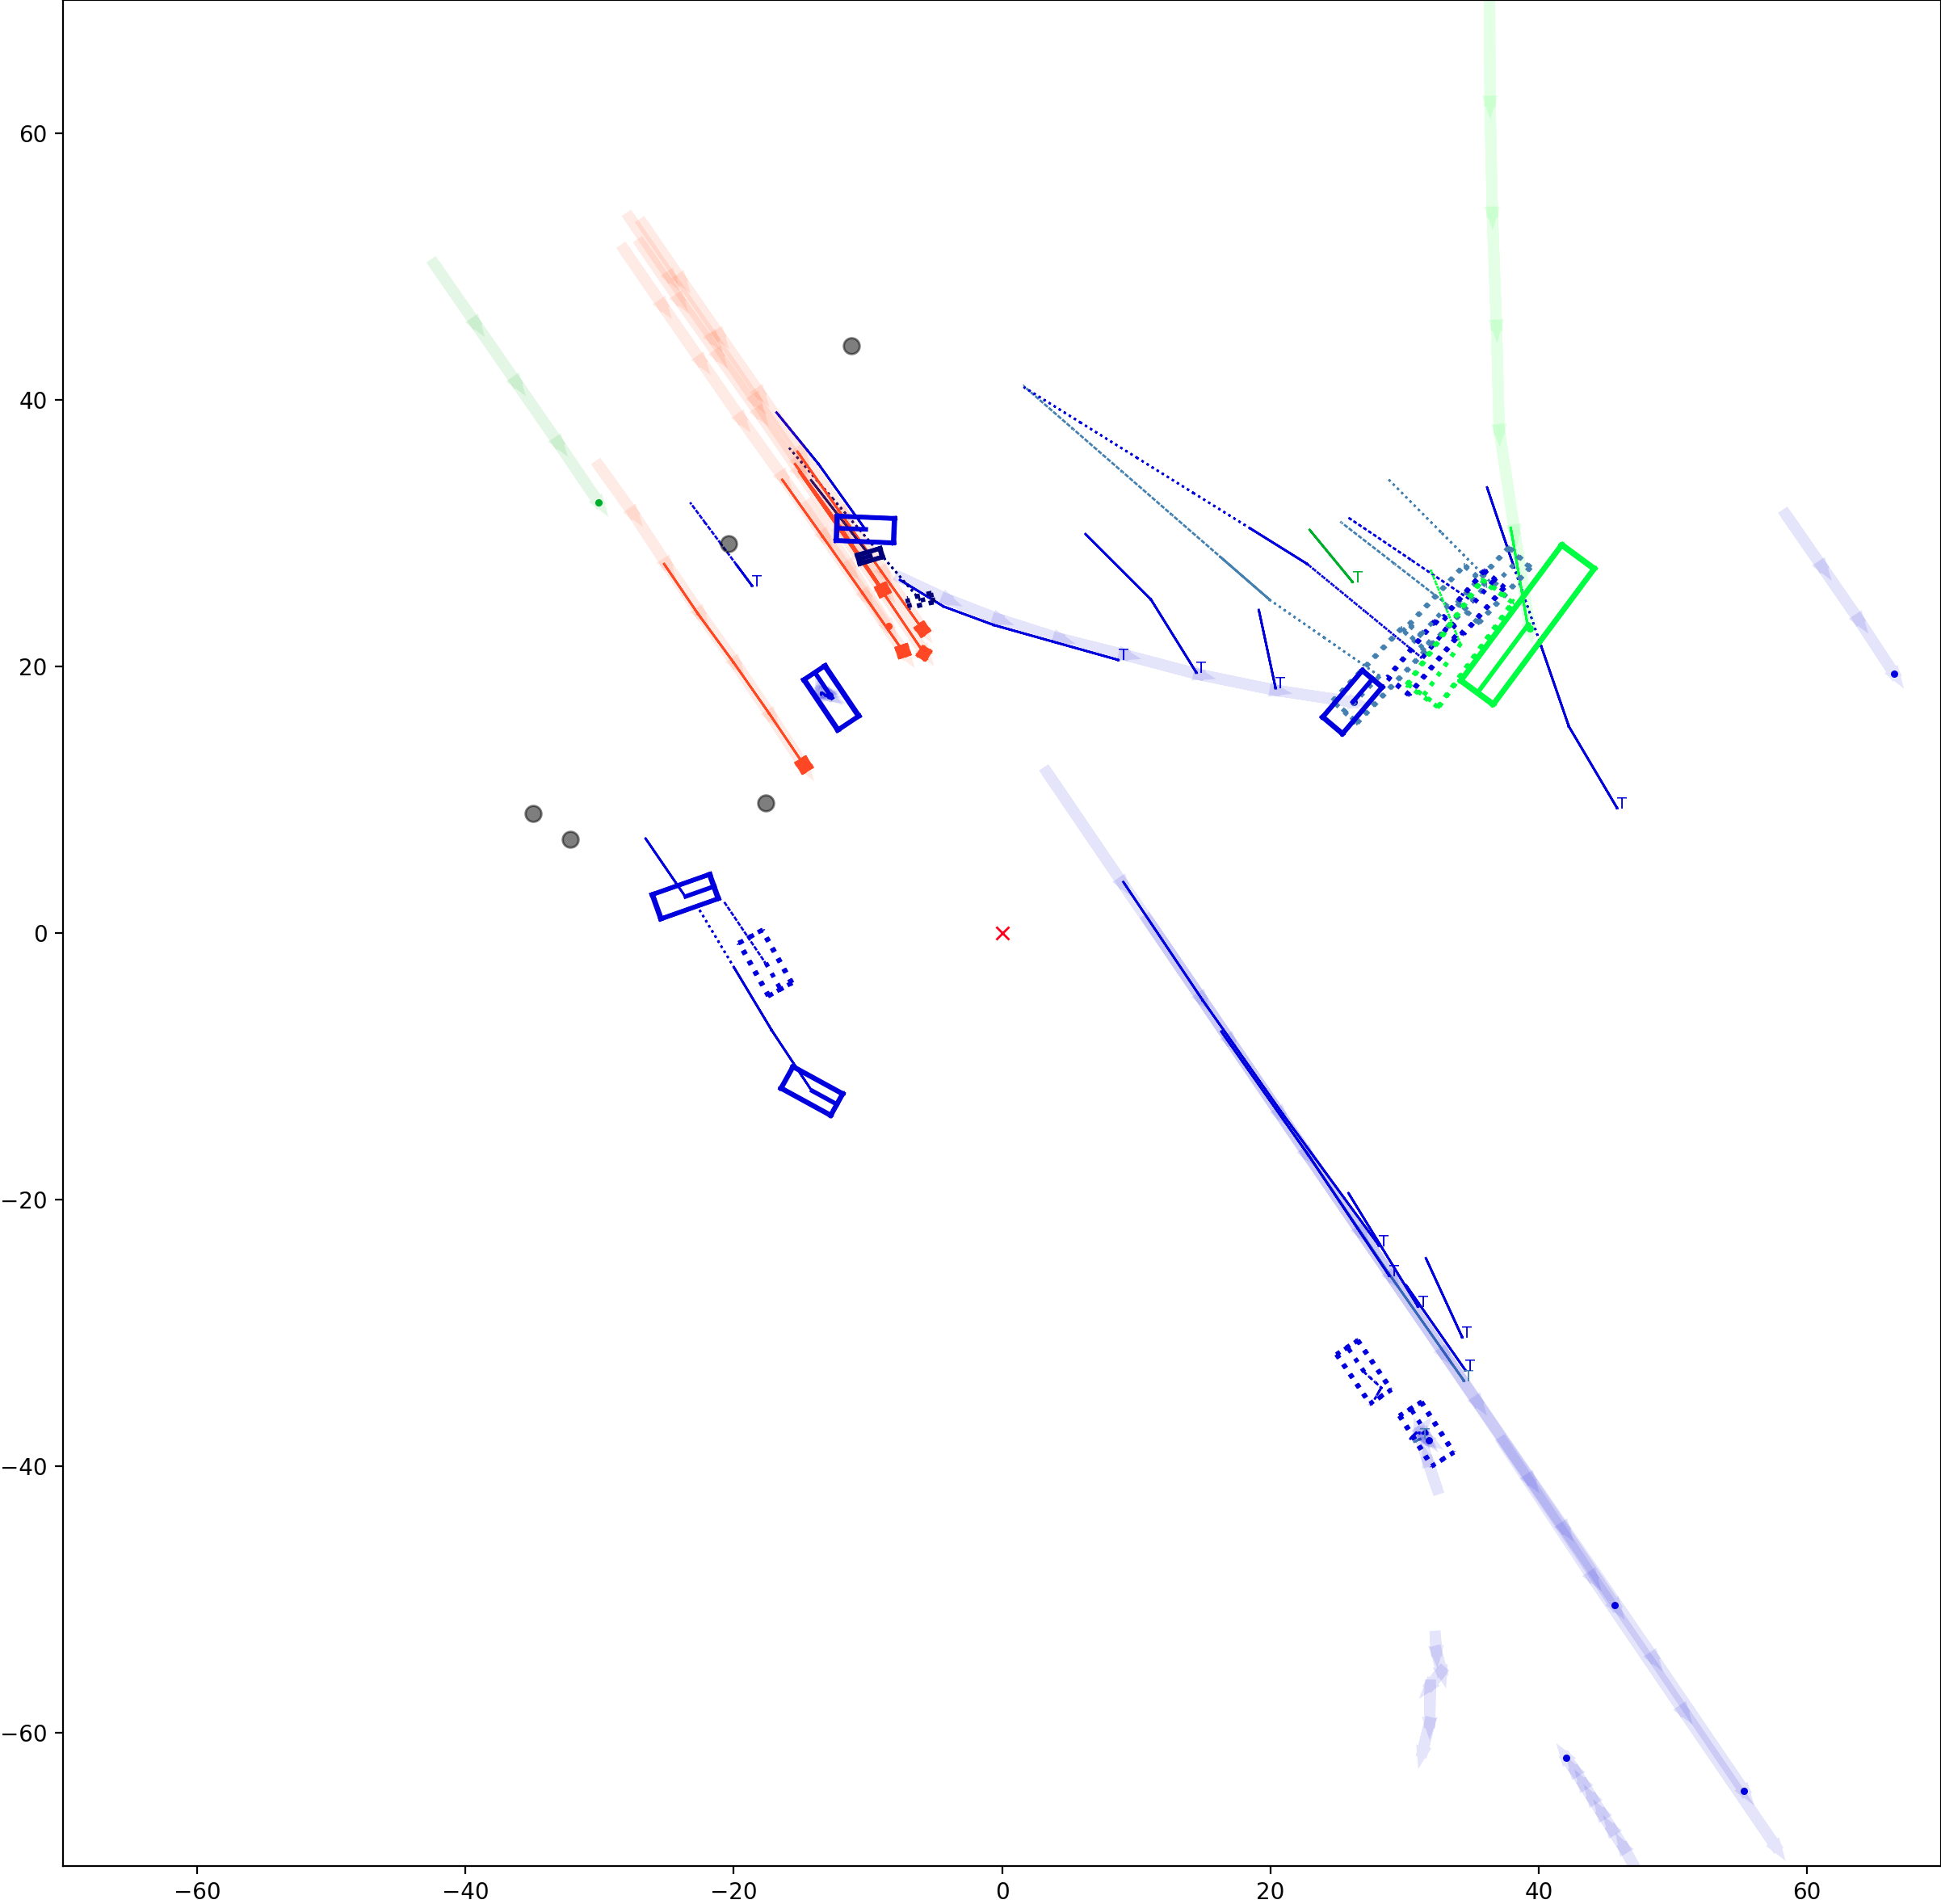
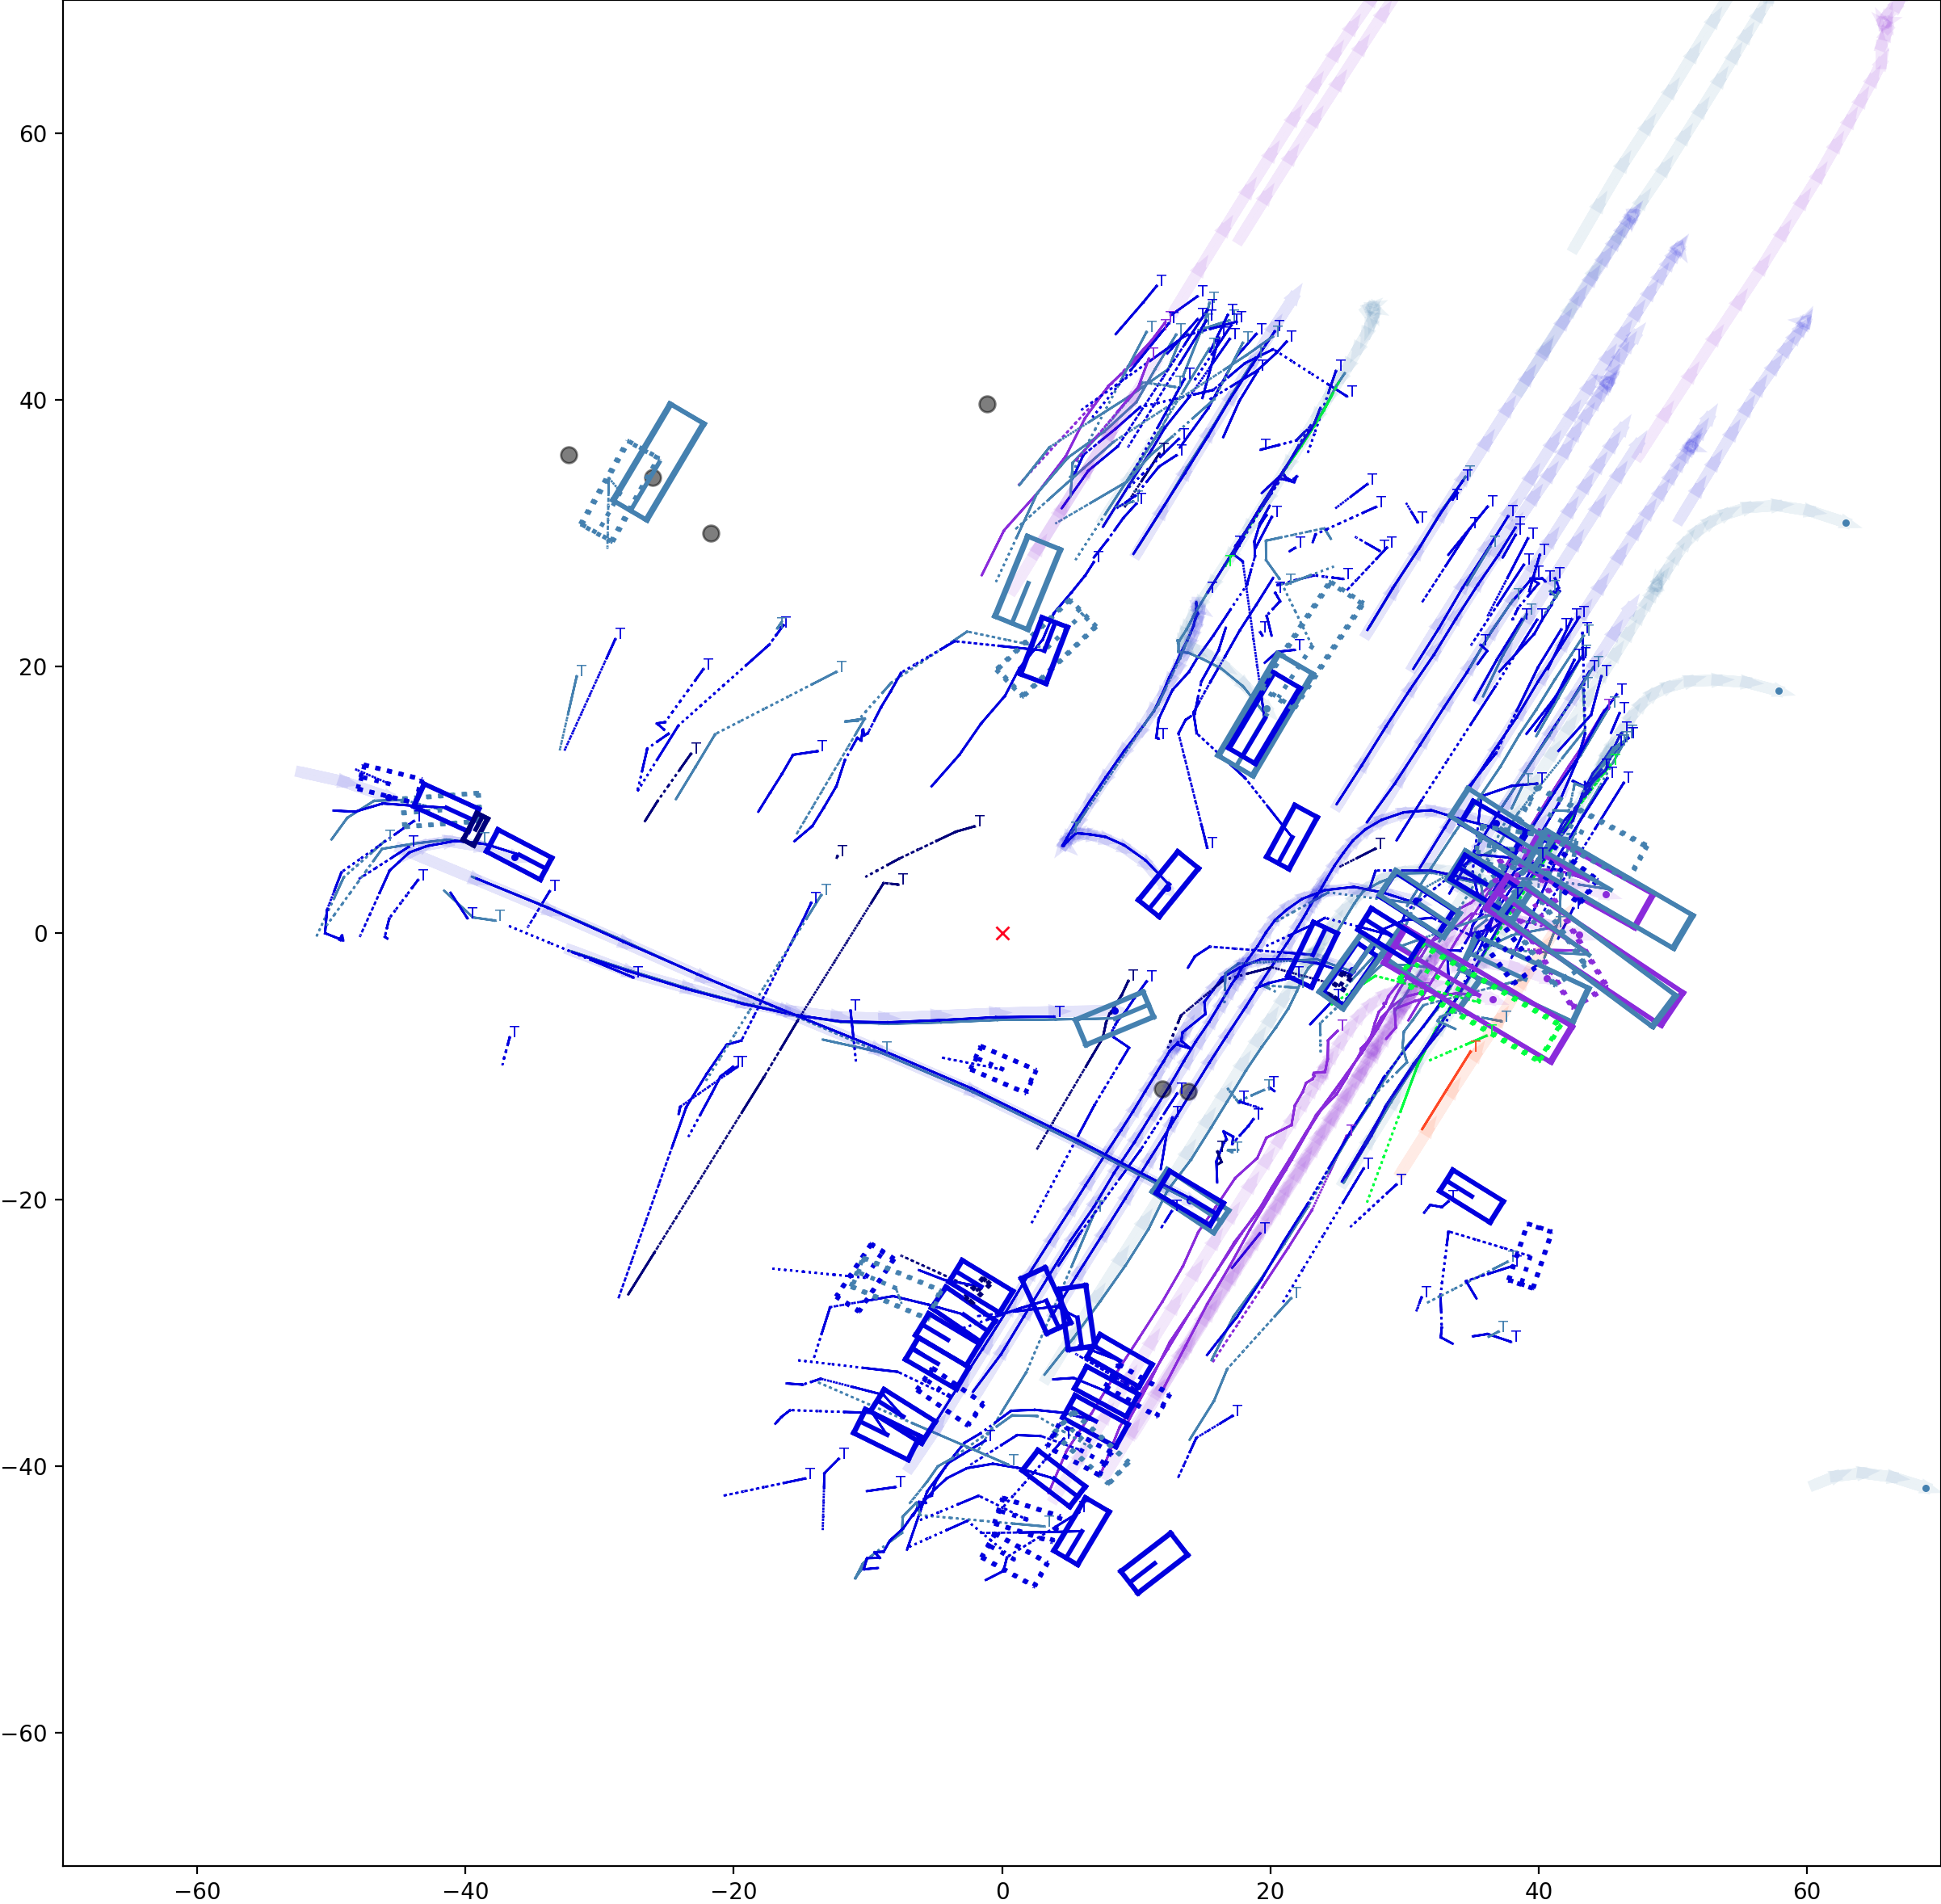
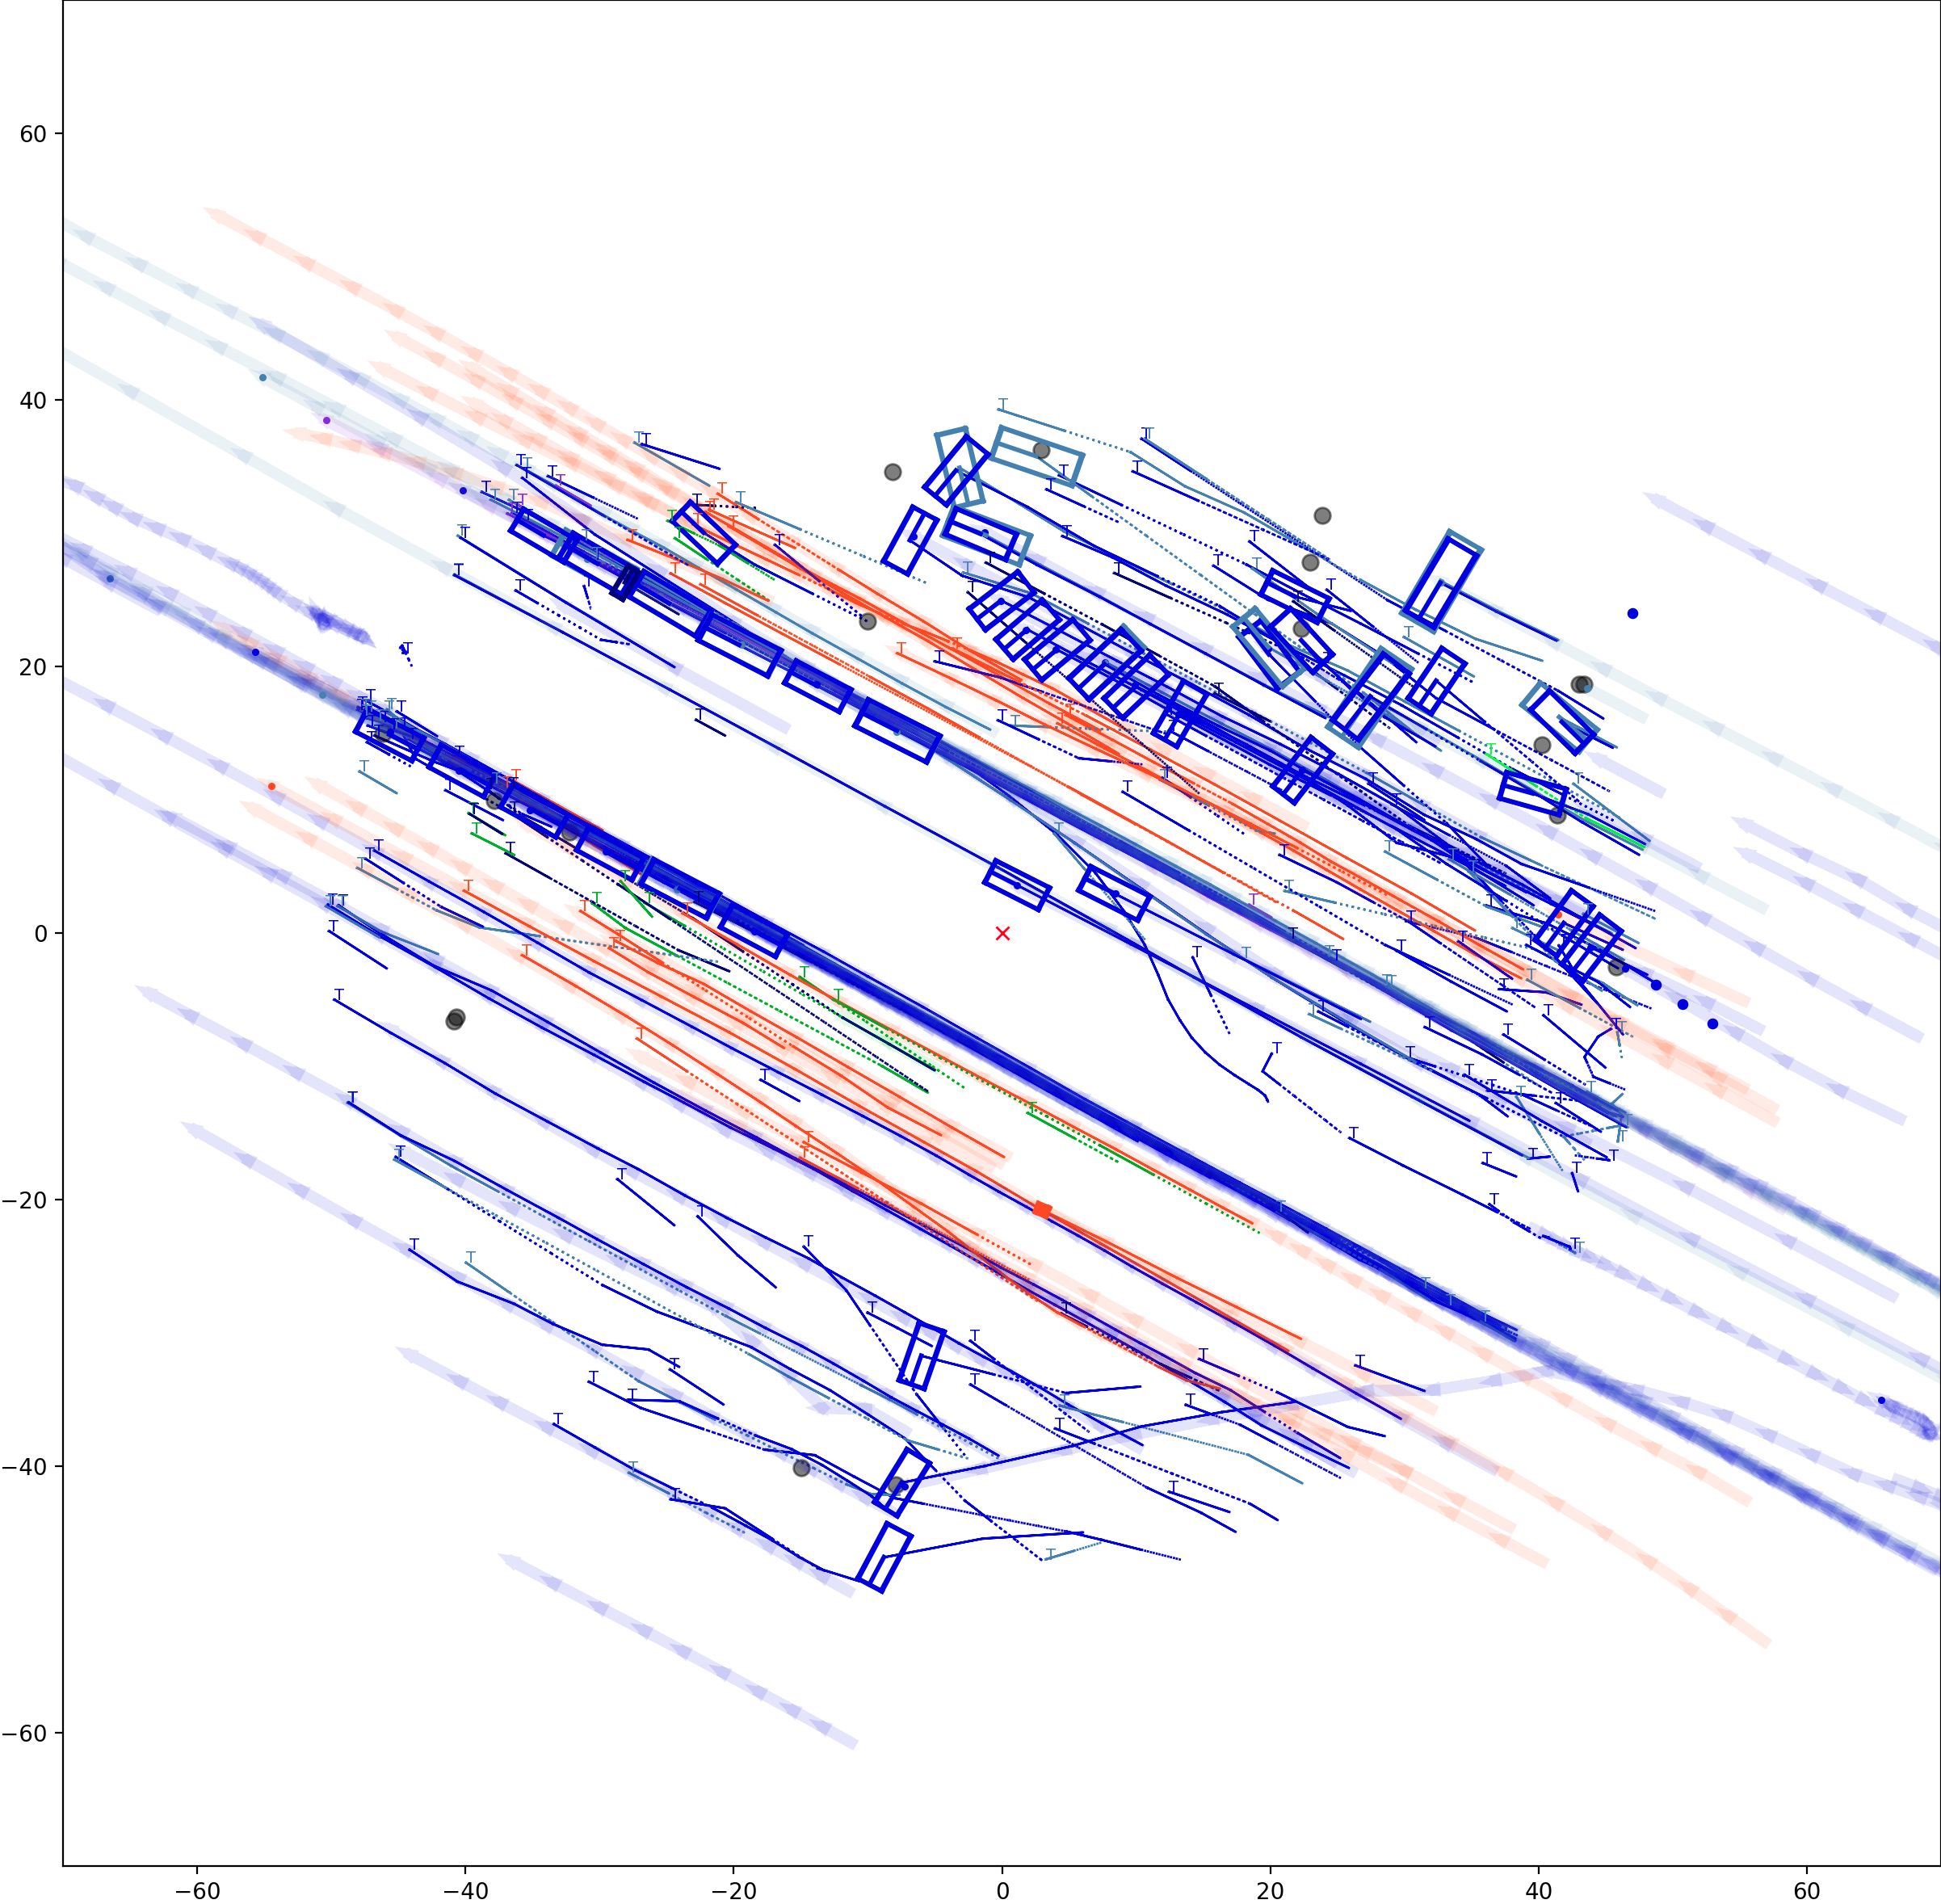
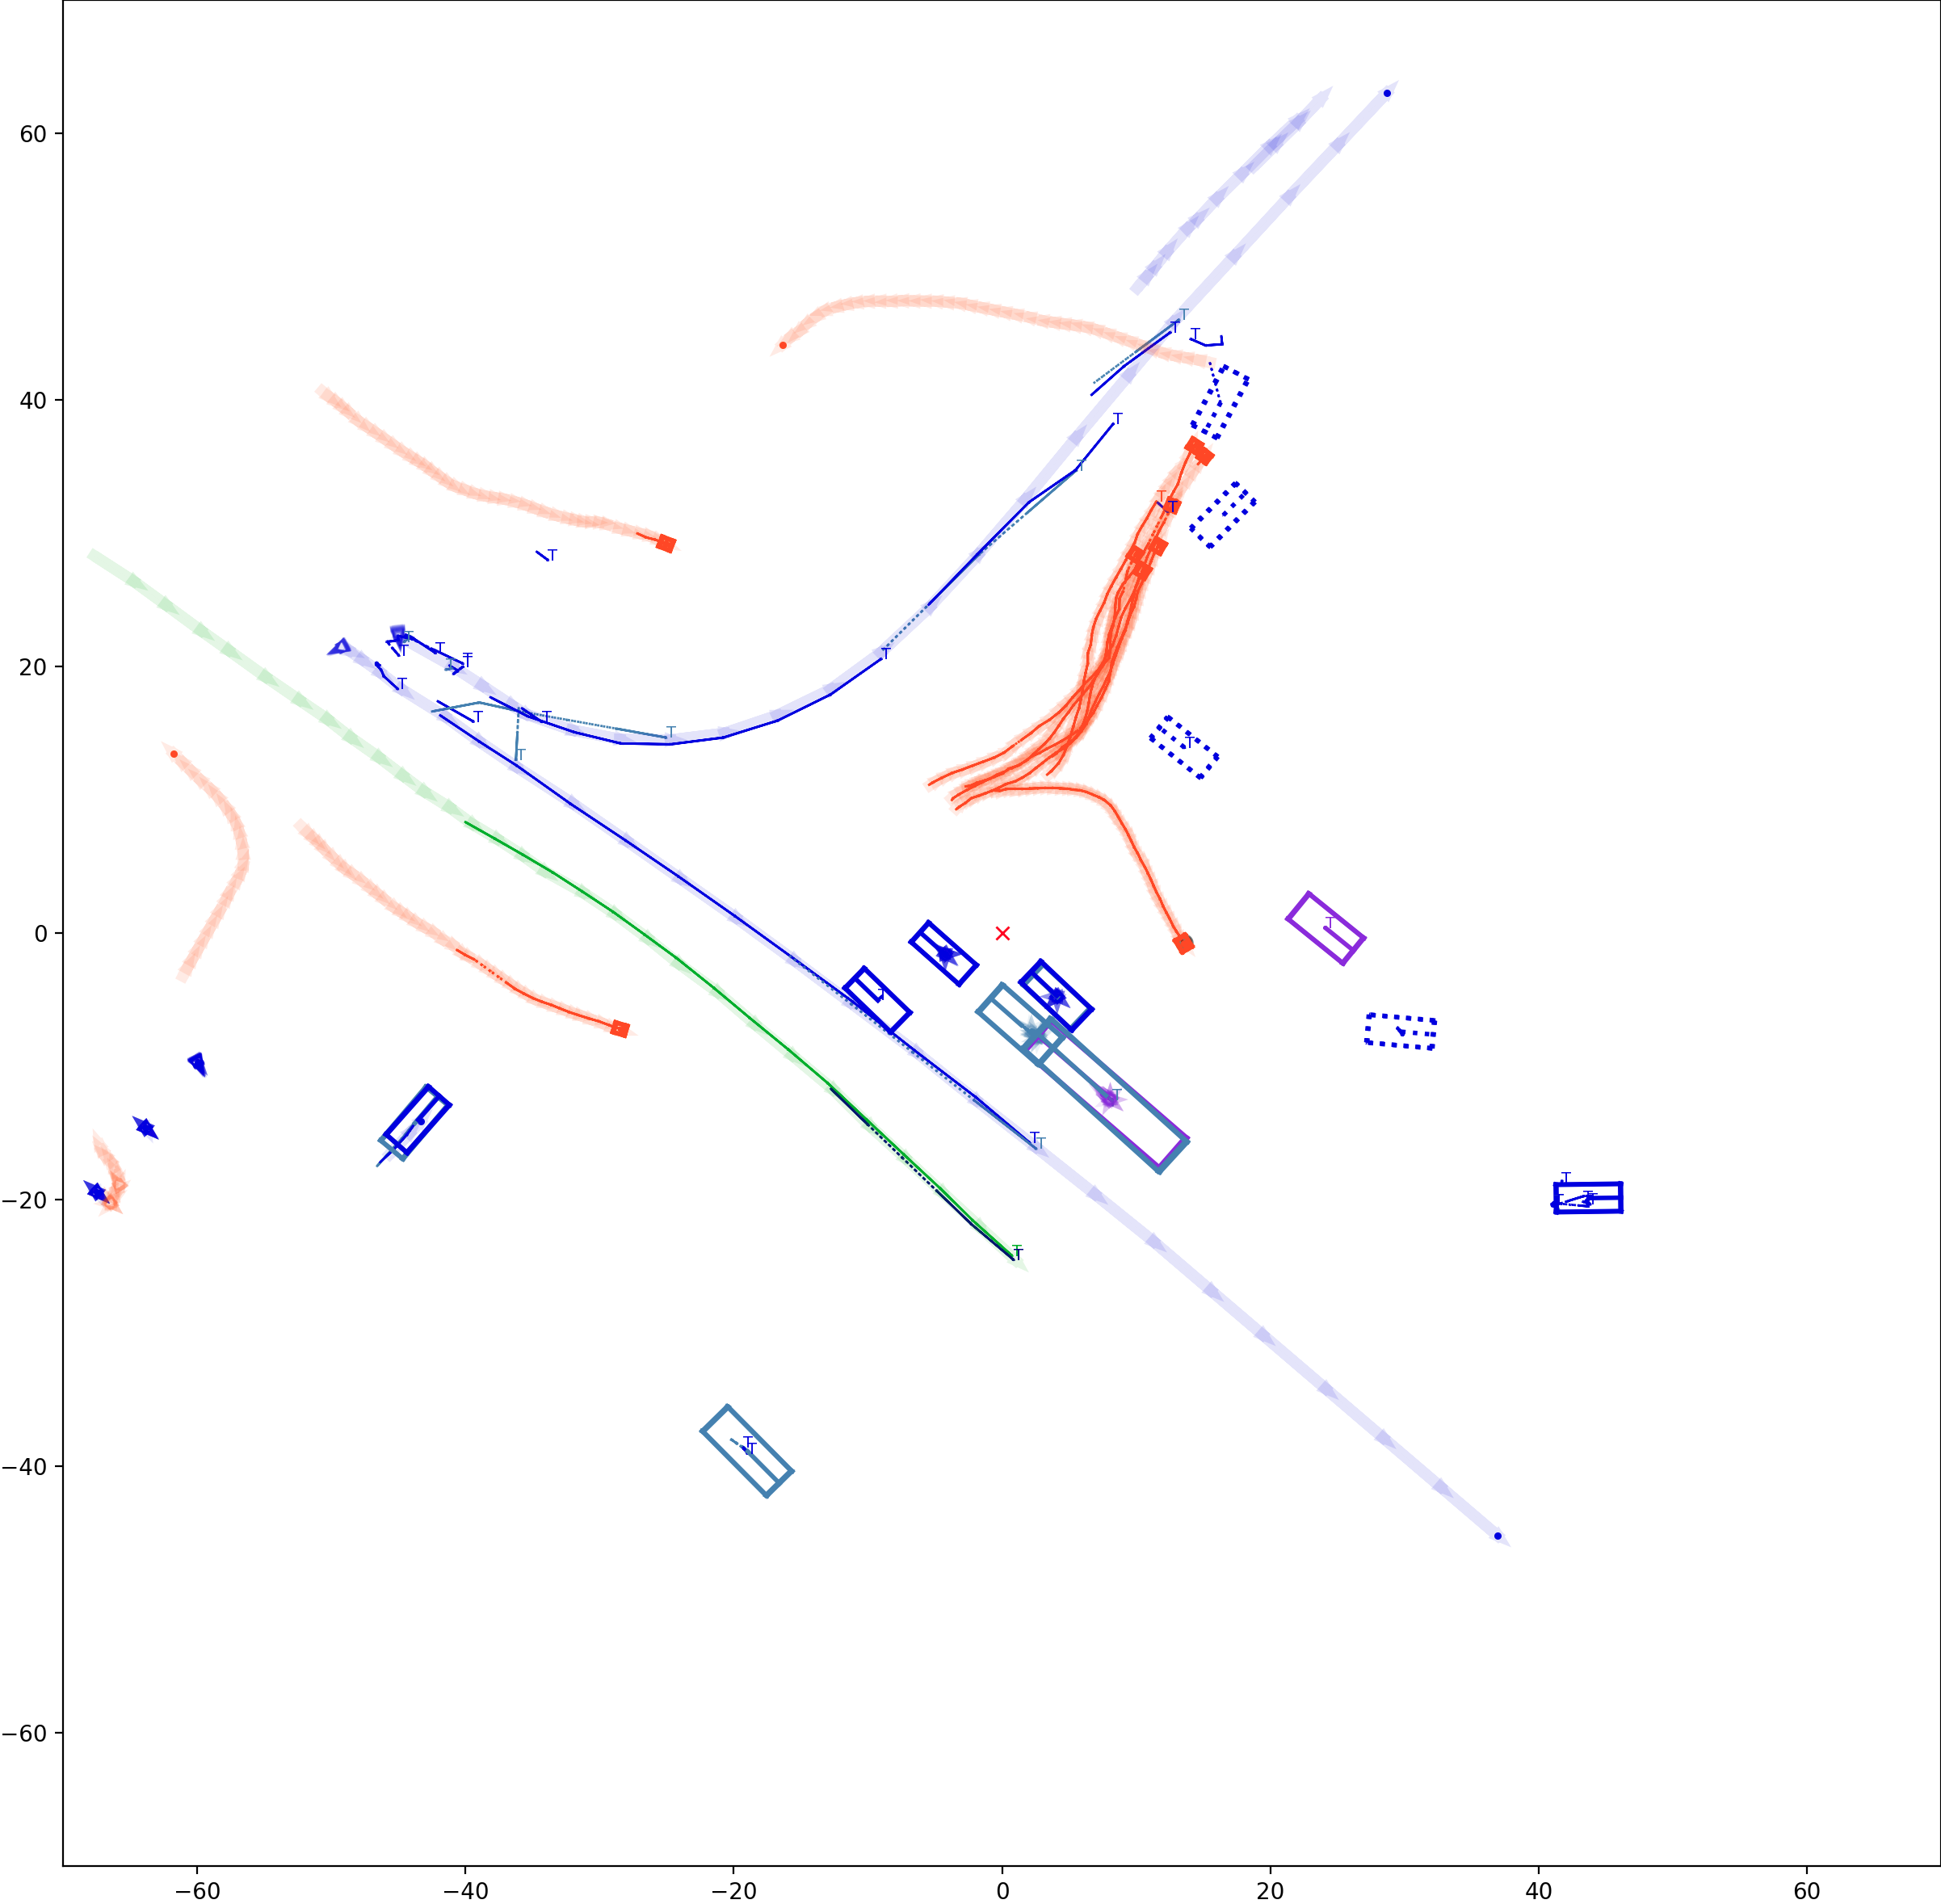
FIGURE 033ada261efee347cba2e7557794f1aec8, two bus tracks intersected, resulting in early termination and restarting of tracks.FIGURE 04 · ANIMATION · 2× SPEED3ada261efee347cba2e7557794f1aec8.gifFIGURE 05crossing caused ID switches e60ef590e3614187b7800db3e5284e1aFIGURE 06 · ANIMATION · 2× SPEEDcrossing.gifFIGURE 31track overlapping caused premature termination of the track 07aed9dae37340a997535ad99138e243
Classification changes12 figures
FIGURE 0719d97841d6f64eba9f6eb9b6e8c257dc Alternating classification caused early termination of the trackFIGURE 0826a6b03c8e2f4e6692f174a7074e54ff classification caused premature terminationFIGURE 19f2541977a00a448db9b46a32187d9059FIGURE 20change birth rate from 0.1 to 0.001 did not resolve the issue, because the missed frame is detected as truckFIGURE 21 · ANIMATION · 2× SPEEDalternating_classification.gifFIGURE 22Alternating Classification afd73f70ff7d46d6b772d341c08e31a5FIGURE 23Alternating Classifications c65c4acf86954f8cbd53a3541a3bfa3aFIGURE 25Alternating Classifications d7bacba9119840f78f3c804134ceece0FIGURE 28change of classification lead to premature track termination 4efbf4c0b77f467385fc2e19da45c989FIGURE 3230a1a4ccd60047b4a22ee3bf0645f3ad entire track with wrong classificationFIGURE 35classification error caused terminationFIGURE 40classification caused early termination 0e247ba64b9d4a34a7256b6c173b1b5d
Birth-rate tuning and track restarts13 figures
FIGURE 09premature termination of track for bus e005041f659c47e194cd5b18ea6fc346FIGURE 11Premature Termination e7ef871f77f44331aefdebc24ec034b7FIGURE 12Problem Resolved by Change birth rate to 0.001FIGURE 13Premature Termination of the Pedestrian Track 2ca15f59d656489a8b1a0be4d9bead4eFIGURE 14resolved by changing birth rate to 0.001FIGURE 15Premature Termination of the Car Track 3b2ee26cb8484f77895bc336663df502 FIGURE 16resolved by setting birth rate to 0.001FIGURE 17Premature Termination of Car Track acc29386502047339e1ec6b9c7e512d2FIGURE 18did not get resolved by changing birth rate from 0.1 to 0.001. The reason this happen is because this part of the track has a curvature.FIGURE 26Problem Solved by changing birth rate from 0.1 to 0.001FIGURE 34termination of the bicycle track due to small birth rate. 1a819a84e3494177b47bea8c7f0770ecFIGURE 38Wrong initiation of new track 8edbc31083ab4fb187626e5b3c0411f7FIGURE 39Problem Solved by changing the birth rate from 0.1 to 0.001
Turning motion4 figures
FIGURE 29turning caused termination of track. This is the second time this appears. but this is already with radar velocity added. 6d872d1448814fd189e631b1187c3771FIGURE 30turning caused track termination 6f83169d067343658251f72e1dd17dbcFIGURE 33turning caused premature termination of track FIGURE 41f2541977a00a448db9b46a32187d9059 Turning caused premature track termination
TO-PMB and MHT comparisons21 figures
FIGURE 439f1f69646d644e35be4fe0122a8b91ef MHT favors the hypothesis for track termination.FIGURE 44TO-PMB tracking result for the same trackFIGURE 45080a52cb8f59489b9cddc7b721808088 MHTFIGURE 46PMBFIGURE 47e7ef871f77f44331aefdebc24ec034b7 MHT sudden jump of track positionFIGURE 48PMBFIGURE 496f83169d067343658251f72e1dd17dbc MHT sudden change of track positionFIGURE 50PMBFIGURE 51d1e57234fd6a463d963670938f9f556e MHTFIGURE 52PMBFIGURE 53b51869782c0e464b8021eb798609f35f MHTFIGURE 54PMBFIGURE 552eb4d7f00e584a548aa0b899638bfb0a MHTFIGURE 56PMBFIGURE 577365495b74464629813b41eacdb711af MHTFIGURE 58PMBFIGURE 59696a45dbd11346b794fdce43fa0a1770 MHTFIGURE 60Original figure; no descriptive caption in the source.FIGURE 61PMBFIGURE 64b07358651c604e2d83da7c4d4755de73 MHTFIGURE 65PMB
Coalescence and long associations8 figures
FIGURE 662eb4d7f00e584a548aa0b899638bfb0aFIGURE 67Original figure; no descriptive caption in the source.FIGURE 68Original figure; no descriptive caption in the source.FIGURE 69Original figure; no descriptive caption in the source.FIGURE 70Original figure; no descriptive caption in the source.FIGURE 71Original figure; no descriptive caption in the source.FIGURE 72connection was made from too far away.FIGURE 73connection was made from too far away
Additional source figures and sequence8 figures
FIGURE 1001452fbfbf4543af8acdfd3e8a1ee806FIGURE 249d1307e95c524ca4a51e03087bd57c29FIGURE 270ac05652a4c44374998be876ba5cd6fdFIGURE 3691c071bcc1ad4fa1b555399e1cfbab79FIGURE 37c525507ee2ef4c6d8bb64b0e0cf0dd32FIGURE 42 · ANIMATION · 2× SPEED0-ANIMATION.gifFIGURE 62Original figure; no descriptive caption in the source.FIGURE 63Original figure; no descriptive caption in the source.
07 / Code and provenance
A map back to the work.
The code spans simulation, nuScenes runners, tracker implementations, and evaluation. Start with the part that matches the question you want to investigate.
Simulation experimentsGNN, PDA, JPDA, GM-PHD, GM-CPHD, PMB, PMBM, and SPA implementations or references.
Tracker implementationsRFS filters, classical baselines, and multiple experimental variants.
Evaluation and saved outputsnuScenes evaluation code and historical result files. Mini and full validation results should be kept separate.
Visualization codeScene-level tracking plots for qualitative inspection.
Reading and reproduction notes
The repository README identifies known implementation errors and credits prior MATLAB implementations.
Runners reference machine-specific dataset paths and configuration JSON files. The exact configuration for the featured log is not bundled with that attachment.
Detector examples in the code include BEVFusion, CenterPoint, Megvii, and PointPillars. Their presence does not identify which checkpoint produced every archived figure.
The 0.761 score comes from the archived evaluation log. Mini-split metrics elsewhere in the repository are separate experiments.