FROM THE LIKELIHOOD RATIO TO JOINT ASSOCIATION
Joint Probabilistic Data Association
Reason jointly.
Update softly.
One return can support several hypotheses. A feasible joint event gives it only one origin.
Fortmann, Bar-Shalom & Scheffe · 1983
Bar-Shalom, Daum & Huang · 2009
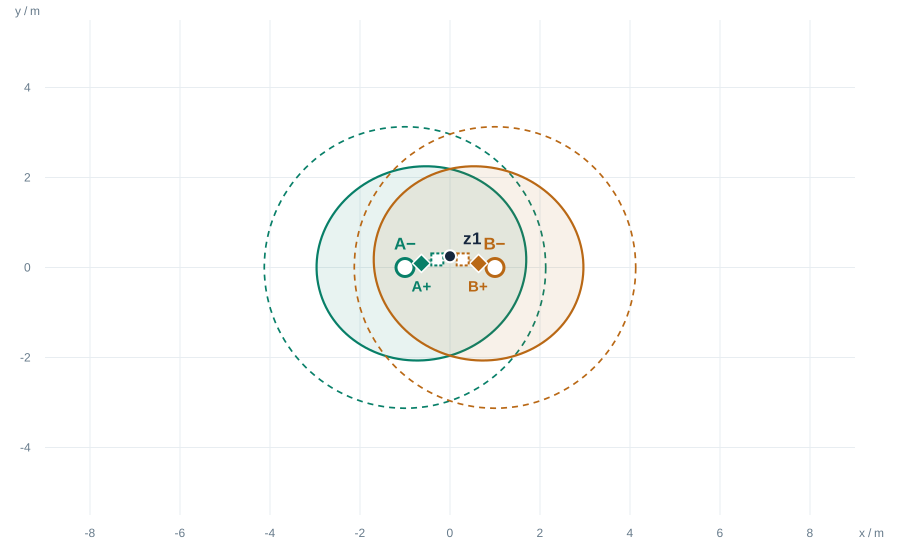
○ prediction · ◆ JPDA mean · □ independent PDA
Dashed: innovation contours · black dot: return
JPDA · Joint Probabilistic Data Association
01 / 13
01 / WHY JOINT?
A shared return couples the association decisions.
Independent PDA
96.9% + 96.9%
Each target normalizes its own hypotheses.
Joint PDA
49.2% + 49.2%
The remaining 1.6% is clutter.
The marginal probabilities come from mutually exclusive joint explanations.
JPDA · Joint Probabilistic Data Association
02 / 13
02 / ASSUMPTIONS
Fix the model before assigning probabilities.
Established point targets
Each target generates zero or one return in a scan. No birth, death, or track management.
Gaussian predictions
Independent predicted target states. Linear position measurements with H = I.
Poisson clutter
Uniform spatial intensity λ. Unassigned returns are clutter; λ is a density, not a probability.
All returns are eligible
\(P_G=1\). Dashed ellipses show uncertainty; they do not reject measurements.
Large-gate simplification: Fortmann et al. (1983), Section III and footnote 5.
JPDA · Joint Probabilistic Data Association
03 / 13
03 / LOCAL EVIDENCE
Start with the PDA likelihood ratio.
\[\ell_{tj}=\frac{\bbox[3px,border:2px solid #b96815]{P_{D,t}}\,\bbox[3px,border:2px solid #2766b1]{\mathcal N(z_j;\mu_t,S_t)}}{\bbox[3px,border:2px solid #7854a3]{\lambda}}\]
\(\mu_t=H\hat x_t^-\): predicted measurement · \(S_t\): innovation covariance
Detection
How likely is target t to generate a return?
Measurement fit
How plausible is zⱼ under the predicted target distribution?
Clutter competition
How much background clutter is expected per unit area?
Bar-Shalom, Daum & Huang (2009), equation (38); target index t added.
JPDA · Joint Probabilistic Data Association
04 / 13
04 / FEASIBLE JOINT EVENTS
Two targets + one return = three explanations.
\(a=(1,0)\)
A generates z₁
B is missed
49.2%
\(a=(0,1)\)
B generates z₁
A is missed
49.2%
\(a=(0,0)\)
z₁ is clutter
Both targets are missed
1.6%
\(a=(1,1)\) is invalid: one return cannot have two target origins.
aₜ = 0 denotes a miss. Positive entries must be distinct. Unassigned returns are clutter.
JPDA · Joint Probabilistic Data Association
05 / 13
05 / SCORE, THEN NORMALIZE
Multiply evidence within each feasible event.
\[w(a)=\prod_{t:a_t=0}(1-P_{D,t})\;\prod_{t:a_t>0}\ell_{t,a_t}\]
\[p(a\mid Z)=\frac{w(a)}{\displaystyle\sum_{a'\in\mathcal A}w(a')}\]
Missed target → multiply by \(1-P_D\).
Assigned return → multiply by its target-to-clutter likelihood ratio.
Poisson form: Fortmann et al. (1983), (3.18); Bar-Shalom et al. (2009), (47).
JPDA · Joint Probabilistic Data Association
06 / 13
06 / SUM CONSISTENT EVENTS
A target’s probability is a sum over joint events.
\[\beta_{tj}=\sum_{a\in\mathcal A:\,a_t=j}p(a\mid Z)\]
Target
Miss
z₁
A
50.8%
49.2%
B
50.8%
49.2%
Clutter
—
1.6%
\(\sum_{j=0}^{m}\beta_{tj}=1\)
Every target has one outcome.
\(\sum_t\beta_{tj}\leq 1\quad(j>0)\)
The remainder is measurement j’s clutter probability.
Marginals: 1983 (3.19)–(3.20); 2009 (51). Values shown for the shared-return scene.
JPDA · Joint Probabilistic Data Association
07 / 13
07 / INTERACTIVE EXPERIMENT
Move the return. Watch the explanations change.
TRY THREE CHANGES
1 Move z₁ toward A.
Which event gains weight?
2 Increase λ.
Does clutter gain support?
3 Lower \(P_D\).
How does “miss” change?
Static baseline: A → z₁ 49.2% · B → z₁ 49.2% · clutter 1.6%.
JPDA · Joint Probabilistic Data Association
08 / 13
08 / STATE UPDATE
Update with a weighted innovation.
\[\hat x_t^+=\hat x_t^-+K_t\bar\nu_t,\qquad \bar\nu_t=\sum_{j=1}^{m}\beta_{tj}(z_j-\mu_t)\]
\[K_t=P_t^-H^\top S_t^{-1},\qquad S_t=HP_t^-H^\top+R\]
Shared-return example: target A
\((-1,0)\ \longrightarrow\ (-0.635,\;0.091)\;\mathrm m\) with \(\beta_{A1}\approx0.492\)
Bar-Shalom et al. (2009), (39)–(41). The miss branch contributes zero innovation.
JPDA · Joint Probabilistic Data Association
09 / 13
09 / UNCERTAINTY
Averaging positions does not remove ambiguity.
\[P_t^+=\sum_{j=0}^{m}\beta_{tj}\!\left[P_{tj}+(\hat x_{tj}-\hat x_t^+)(\hat x_{tj}-\hat x_t^+)^\top\right]\]
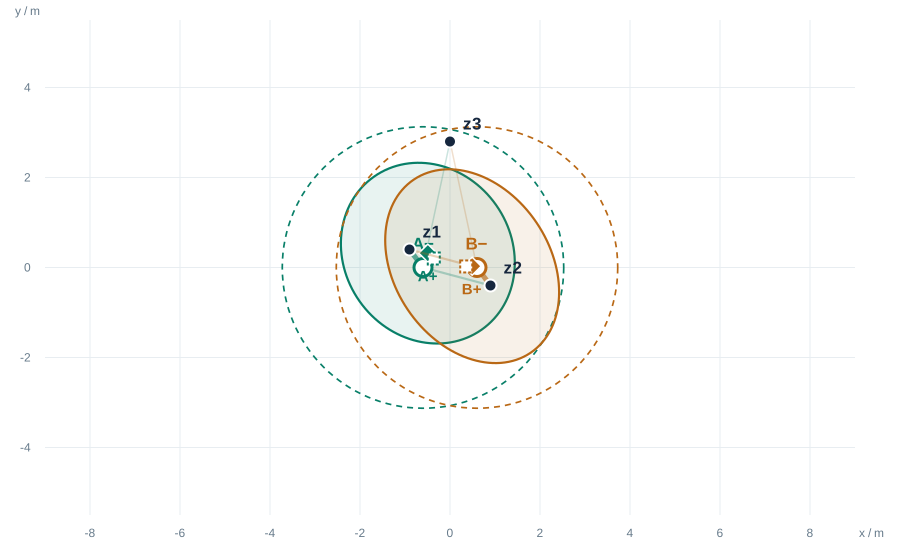
Within-branch covariance
+ between-branch spread
Keep uncertainty about which return belongs to the target.
Equivalent mixture form of 2009 (42)–(44). j = 0 is the unchanged prior branch.
JPDA · Joint Probabilistic Data Association
10 / 13
10 / WHAT IS EXACT HERE?
Exact event sums. Approximate recursive filtering.
One scan
All feasible joint events are enumerated. The event sums are exact for the stated prediction model.
State compression
JPDAF keeps Gaussian marginal moments. It does not retain the full mixture of joint track histories.
Scale & ambiguity
Event counts grow rapidly. Persistent ambiguity can pull tracks together: coalescence.
This lab uses decoupled JPDAF updates. JPDACF also maintains cross-covariances between target states.
JPDA · Joint Probabilistic Data Association
11 / 13
11 / BACK TO EXTENDED TARGETS
Similar factor roles. Different measurement models.
Point-target JPDA
One target → at most one return.
\(P_D\) is a detection probability.
λ is clutter intensity per unit area.
Grouped extended-target likelihood
One target → a group of returns.
\(\mu_m\) is a mean measurement count.
The count exponential and group clutter terms also matter.
The matching colors compare detection, measurement-fit, and clutter roles.
JPDA · Joint Probabilistic Data Association
12 / 13
PRIMARY SOURCES / READ FURTHER
Two papers behind this deck and lab.
1983
Sonar Tracking of Multiple Targets Using
Joint Probabilistic Data Association
Thomas E. Fortmann, Yaakov Bar-Shalom & Molly Scheffe
IEEE Journal of Oceanic Engineering · OE-8(3), 173–184 · July 1983
2009
The Probabilistic Data Association Filter
Yaakov Bar-Shalom, Fred Daum & Jim Huang
IEEE Control Systems Magazine · 82–100 · December 2009
JPDA · Joint Probabilistic Data Association
13 / 13